- 話題1/3
18k 熱度
27k 熱度
21k 熱度
49k 熱度
20k 熱度
- 置頂
- 📢 Gate廣場 #MBG任务挑战# 發帖贏大獎活動火熱開啓!
想要瓜分1,000枚MBG?現在就來參與,展示你的洞察與實操,成爲MBG推廣達人!
💰️ 本期將評選出20位優質發帖用戶,每人可輕鬆獲得50枚MBG!
如何參與:
1️⃣ 調研MBG項目
對MBG的基本面、社區治理、發展目標、代幣經濟模型等方面進行研究,分享你對項目的深度研究。
2️⃣ 參與並分享真實體驗
參與MBG相關活動(包括CandyDrop、Launchpool或現貨交易),並曬出你的參與截圖、收益圖或實用教程。可以是收益展示、簡明易懂的新手攻略、小竅門,也可以是現貨行情點位分析,內容詳實優先。
3️⃣ 鼓勵帶新互動
如果你的帖子吸引到他人參與活動,或者有好友評論“已參與/已交易”,將大幅提升你的獲獎概率!
MBG熱門活動(帖文需附下列活動連結):
Gate第287期Launchpool:MBG — 質押ETH、MBG即可免費瓜分112,500 MBG,每小時領取獎勵!參與攻略見公告:https://www.gate.com/announcements/article/46230
Gate CandyDrop第55期:CandyDrop x MBG — 通過首次交易、交易MBG、邀請好友註冊交易即可分187,500 MBG!參與攻略見公告:https://www.gate.com/announcements
- 🎉 Gate廣場“星火計劃”入駐KOL突破1000人!
💥 創作者生態迎來全面爆發期!
📈 上首頁、拿獎勵、贏影響力,你還在等什麼?
💰 現金激勵 ✔️
🚀 流量扶持 ✔️
👑 專屬認證 ✔️
從0到1000,我們只用了短短數周,Gate廣場正在成爲Web3內容風暴眼⚡
你發布的不只是內容,而是下一個“爆款機會”!
🌟 加入星火計劃,開啓你的爆發之路!
👉 https://www.gate.com/announcements/article/45695
#GateSquare # #星火计划# #内容创作者新纪元 # #KOL集结令#
- 📢 #Gate广场征文活动第三期# 正式啓動!
🎮 本期聚焦:Yooldo Games (ESPORTS)
✍️ 分享獨特見解 + 參與互動推廣,若同步參與 Gate 第 286 期 Launchpool、CandyDrop 或 Alpha 活動,即可獲得任意獎勵資格!
💡 內容創作 + 空投參與 = 雙重加分,大獎候選人就是你!
💰總獎池:4,464 枚 $ESPORTS
🏆 一等獎(1名):964 枚
🥈 二等獎(5名):每人 400 枚
🥉 三等獎(10名):每人 150 枚
🚀 參與方式:
在 Gate廣場發布不少於 300 字的原創文章
添加標籤: #Gate广场征文活动第三期#
每篇文章需 ≥3 個互動(點讚 / 評論 / 轉發)
發布參與 Launchpool / CandyDrop / Alpha 任一活動的截圖,作爲獲獎資格憑證
同步轉發至 X(推特)可增加獲獎概率,標籤:#GateSquare 👉 https://www.gate.com/questionnaire/6907
🎯 雙倍獎勵機會:參與第 286 期 Launchpool!
質押 BTC 或 ESPORTS,瓜分 803,571 枚 $ESPORTS,每小時發放
時間:7 月 21 日 20:00 – 7 月 25 日 20:00(UTC+8)
🧠 寫作方向建議:
Yooldo
- 🎉Gate 2025 上半年社區盛典:內容達人評選投票火熱進行中 🎉
🏆 誰將成爲前十位 #Gate广场# 內容達人?
投票現已開啓,選出你的心頭好
🎁贏取 iPhone 16 Pro Max、限量週邊等好禮!
📅投票截止:8 月 15 日 10:00(UTC+8)
立即投票: https://www.gate.com/activities/community-vote
活動詳情: https://www.gate.com/announcements/article/45974
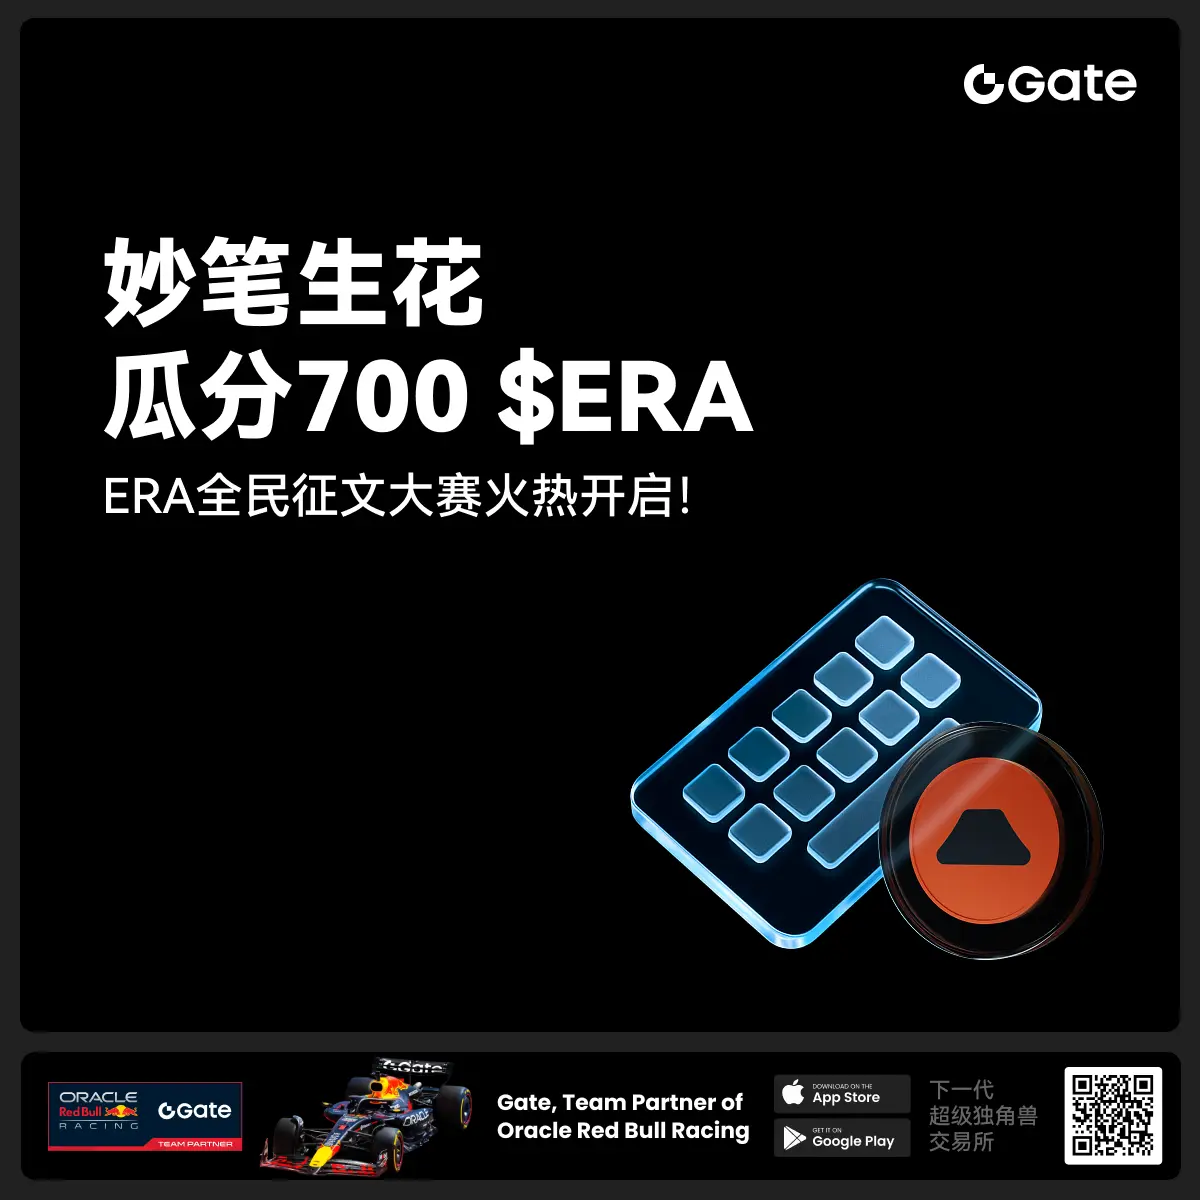
- 📢 #Gate广场征文活动第二期# 正式啓動!
分享你對 $ERA 項目的獨特觀點,推廣ERA上線活動, 700 $ERA 等你來贏!
💰 獎勵:
一等獎(1名): 100枚 $ERA
二等獎(5名): 每人 60 枚 $ERA
三等獎(10名): 每人 30 枚 $ERA
👉 參與方式:
1.在 Gate廣場發布你對 ERA 項目的獨到見解貼文
2.在貼文中添加標籤: #Gate广场征文活动第二期# ,貼文字數不低於300字
3.將你的文章或觀點同步到X,加上標籤:Gate Square 和 ERA
4.徵文內容涵蓋但不限於以下創作方向:
ERA 項目亮點:作爲區塊鏈基礎設施公司,ERA 擁有哪些核心優勢?
ERA 代幣經濟模型:如何保障代幣的長期價值及生態可持續發展?
參與並推廣 Gate x Caldera (ERA) 生態周活動。點擊查看活動詳情:https://www.gate.com/announcements/article/46169。
歡迎圍繞上述主題,或從其他獨特視角提出您的見解與建議。
⚠️ 活動要求:
原創內容,至少 300 字, 重復或抄襲內容將被淘汰。
不得使用 #Gate广场征文活动第二期# 和 #ERA# 以外的任何標籤。
每篇文章必須獲得 至少3個互動,否則無法獲得獎勵
鼓勵圖文並茂、深度分析,觀點獨到。
⏰ 活動時間:2025年7月20日 17
ETH 4小時K線分析:關鍵價位及交易策略解讀
【幣界】最近4小時K線顯示價格相比2025-07-20 12:00:00大幅下跌,比2025-07-19 12:00:00有所回升,比2025-07-20 00:00:00有所下降,小陽柱,最後一根K線爲陽線,收盤價大於開盤價, 當前價格和交易量的變化:最近交易量有所增加,交易量比前幾小時增加,價格和交易量同時上升:交易活躍,漲動能強勁 最近K線顯示出的技術指標分析是: 基於MACD分析當前市場趨勢:無明顯趨勢,MACD柱狀圖:柱狀圖持續爲負並逐漸變長:空軍力量強大。 KDJ指標:KDJ死叉,根據KDJ判斷:超買KDJ值爲:100 MA10的值大於MA30的值,日期2025-07-20 16:00:00,MA10的值大於MA30的值,日期2025-07-20 20:00:00, RSI的值大於70,可能會衝高回落,跌勢,量價格背離, 基於最新的數據,分析顯示: 買入點一: 價格3568.86 買入點二: 價格3143.5038 做多止損點: 價格3134.75 賣出點一: 價格3796.0 賣出點二: 價格3831.86 做空止損點: 價格3804.98 最近的支撐位: 價格3421.0 最近的阻力位: 價格3796.0 最近的最高點: 3786.05 最近的最低點: 3150.5 通過對ETH的4小時k線分析,具體內容如下: 買入點一: 價格3568.86 買入點二: 價格3143.5038 做多止損點: 價格3134.75 賣出點一: 價格3796.0 賣出點二: 價格3831.86 做空止損點: 價格3804.98 最近的支撐位: 價格3421.0 最近的阻力位: 價格3796.0 最近的最高點: 3786.05 最近的最低點: 3150.5