Position above 43060. Set stop loss at 43450!
View OriginalSickCatMakesAContrac
One-way Holdings,
Pin
SickCatMakesAContrac
What does the shadow doppelganger do?
View Original
- Reward
- 2
- 7
- Share
LeekLi:
pro, it's been a long time since there has been any activity.View More
5413/54035, empty to this position first, when will the last orange endpoint of Figure 1 be given, when will it go long, everything else is nonsense! Just follow the orange in Figure 1, and keep T-ing in the middle.
View Original

- Reward
- 1
- Comment
- Share
If this kind of trend emerges, it would be the most perfect one.
View Original
- Reward
- 1
- 7
- Share
LeeGg23:
The BTC of 73,800 seems to have peaked, is it about to fall?View More
Today, please close a small level and then break through to close at 120, that would be perfect if it consolidates at 120 today.
View Original
- Reward
- 1
- 4
- Share
Anyu :
:
Where to prepare for shortingView More
I knew it! It would be painful when it dropped to 59600!! I have recovered some of it now, and I'm betting that the institutions will shake out the retail investors for another month and a half before breaking even again and reaching new highs (orange trend).
View Original

- Reward
- 1
- 1
- Share
PizzaMan:
Extreme deals, Mr. CatETH is rubbish. It's better if it doesn't rise. It's painful to lose with other altcoins.
ETH0.48%

- Reward
- like
- Comment
- Share
The charm of the Chandelier Exit! Don't mechanically apply it. Since mid-February, all movements have been based on a 120-minute pivotal point. It's too rigid to use a 240-minute chart, and it's definitely wrong and awkward.
View Original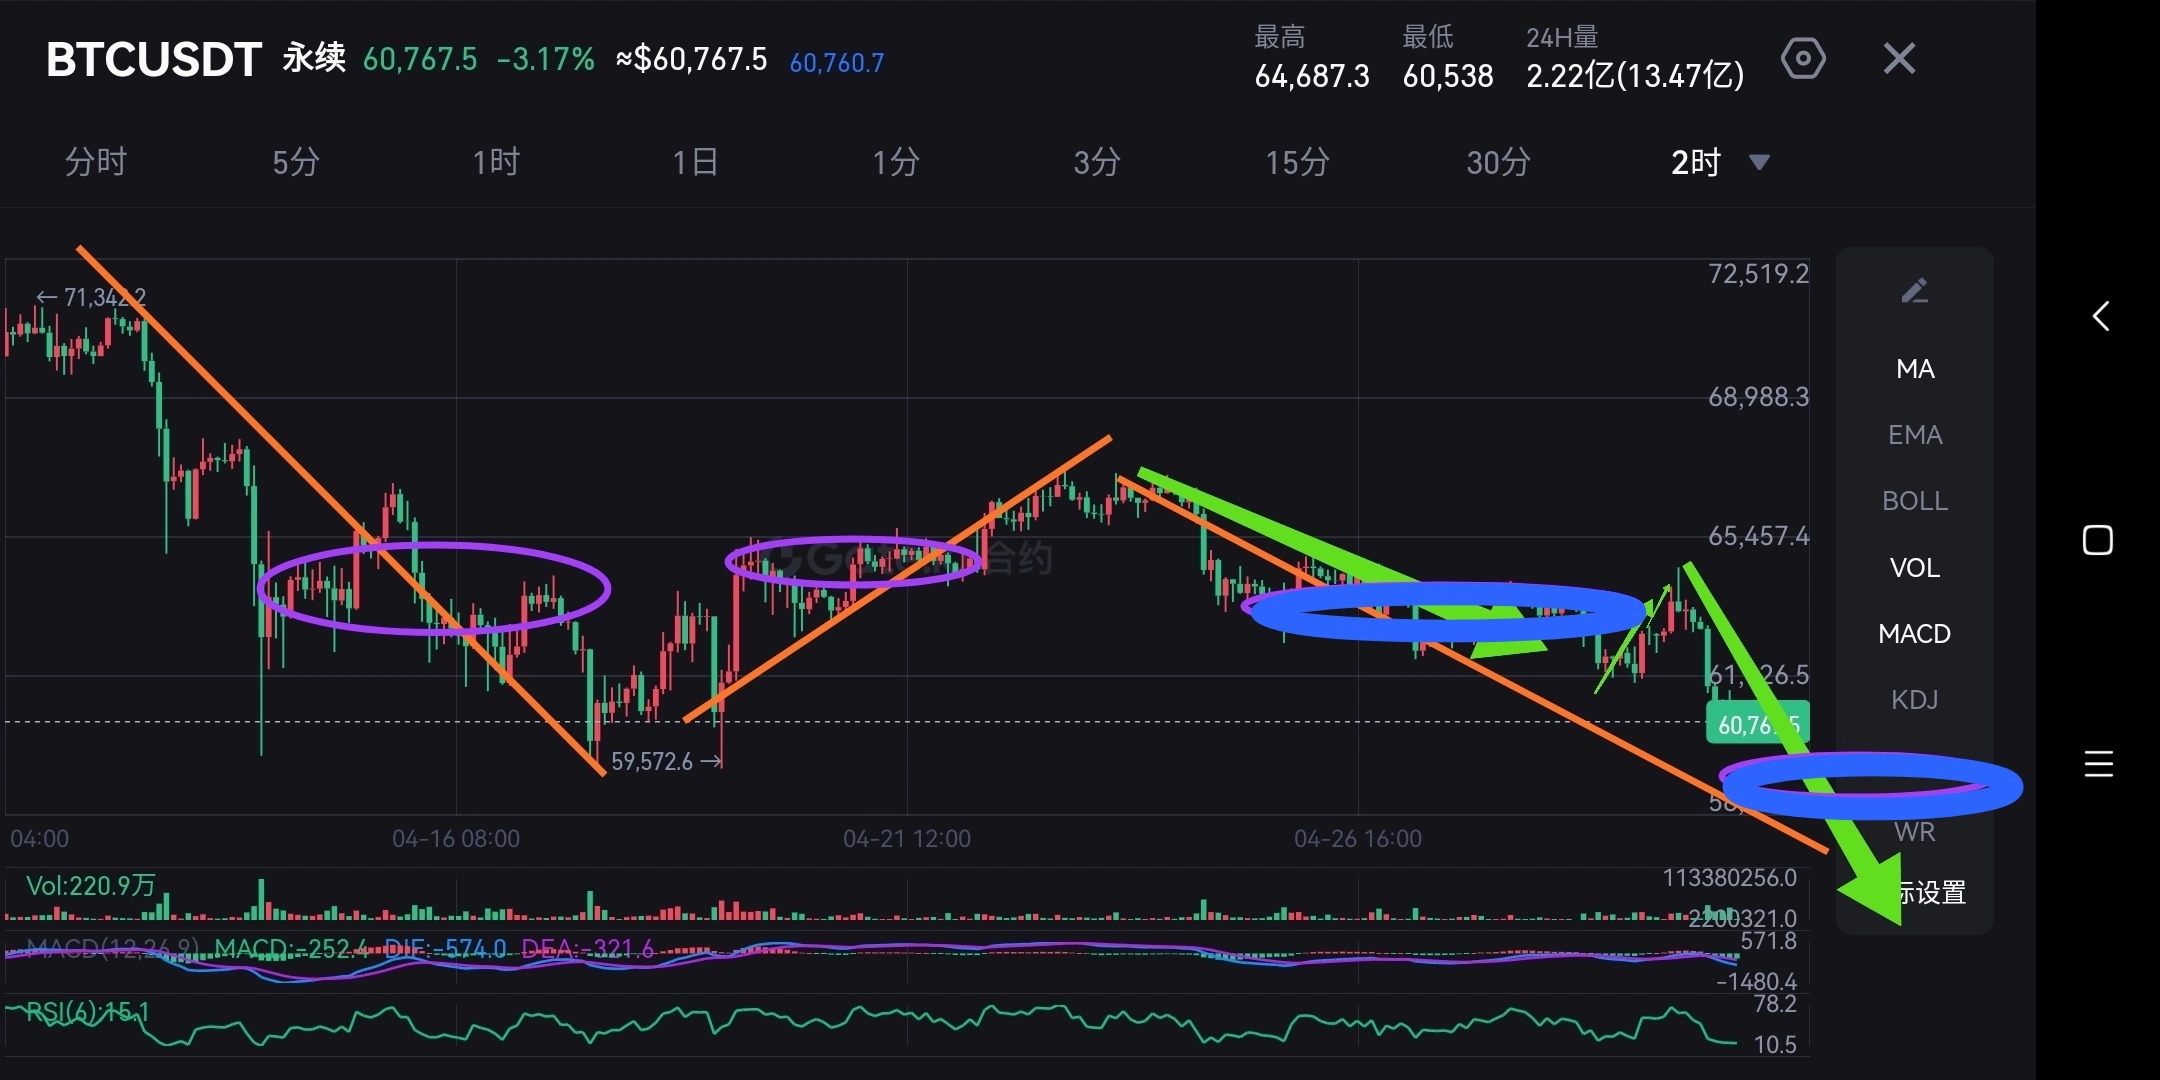
- Reward
- like
- 3
- Share
33333OutOf5:
Going to plummet?View More
Fell below 59600, Yuan Fang, what do you think?
View Original
- Reward
- 1
- 9
- Share
MultipleWealth,Multipl:
The Gold-Swallowing Divine Beast live-streamed a study togetherView More
This platform also has some other accounts, which may have very low activity in the future, but they are still there [grinning face] [grinning face] [grinning face]. Four-hour triple buying, 30-minute double pivot top and bottom, and the next trend reversal in the four-hour chart!
View Original

- Reward
- 8
- 2
- Share
老王多空都赚 :
:
Lost? 
View More
Wait! Consider making a trade when the pattern forms. Otherwise, it could be very risky.
View Original
- Reward
- 4
- 21
- Share
Aogen:
Ether what position is the topView More
Today, I estimate that I can still wait for an opportunity to do it again later. Remember to buy at 15/30 bottom and at the 240 level.
View Original

- Reward
- 3
- Comment
- Share
The air force is too strong, and after the pullback, it is estimated that we will have to counterattack and eliminate the air force. Let's wait, there is no positional advantage anymore.
View Original
- Reward
- 3
- Comment
- Share
See if there will be two 15/30 pivots to break 240 out of the last stroke
View Original
- Reward
- 1
- 1
- Share
DirectorOfFinancialBu:
Blast pullIt's really difficult to do. Set stop-loss for both buying and selling.
View Original
- Reward
- like
- 7
- Share
LuXiaoyou:
There's a direction, there's no big guyView More
Two trends, two approaches to orders. We will assess the situation before entering a short position at 43060 based on the market conditions.
View Original
- Reward
- 6
- 4
- Share
ZeroInTheCurrencyCir:
The position of 43000 is still emptyView More
New highs continue to be empty. Fall to 42000 to consider more, preferably below 41000. At the moment, the longs and shorts are not moving
View Original
- Reward
- 4
- 1
- Share
BabyƵ:
Continue selling to new highs. Consider buying only if the price falls to 42000, preferably below 41000. Currently, it is not recommended to open either buy or sell positions.- Reward
- 5
- Comment
- Share
Class two, new highs
View Original
- Reward
- 2
- 7
- Share
EthereumDaddy:
It's been a long time since you've been bubblingView More
At present, 3/5 minute center, wait for one to two 15/30 centers can continue more, or extend it later. Wait for this opportunity. At the moment, the longs and shorts are not moving
View Original
- Reward
- 3
- 5
- Share
Aogen:
Can there be more now?View More
Pull directly or pull back to continue!
View Original
- Reward
- 2
- 1
- Share
Aogen:
Will tune it up