Chang'anUnderstandsLiA
No content yet
Chang'anUnderstandsLiA
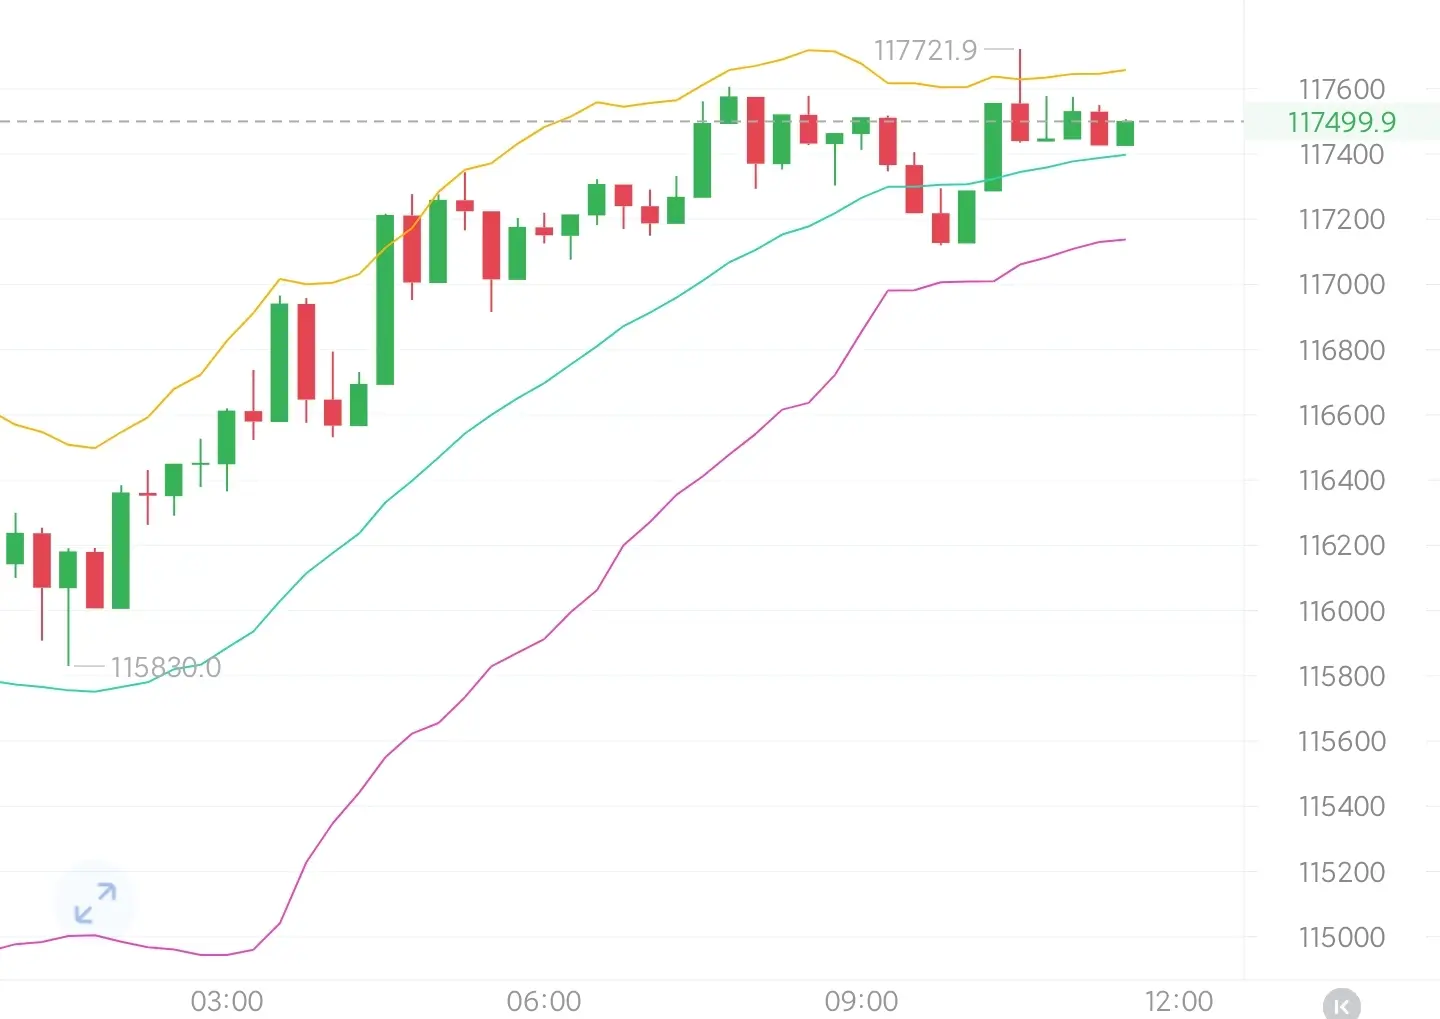
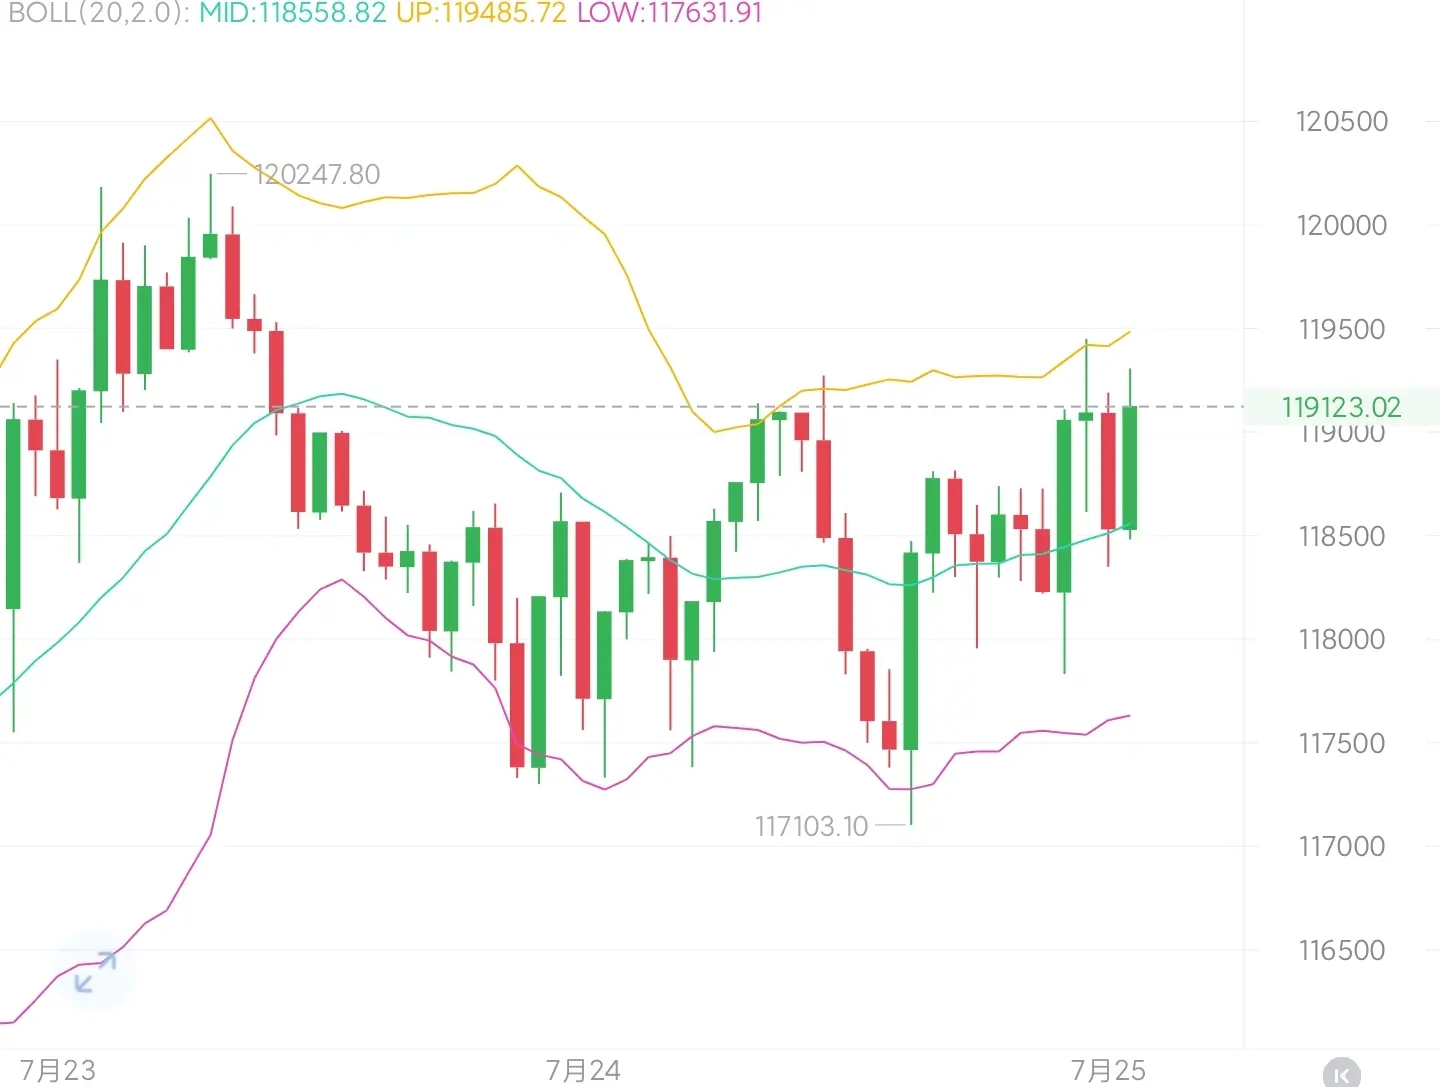
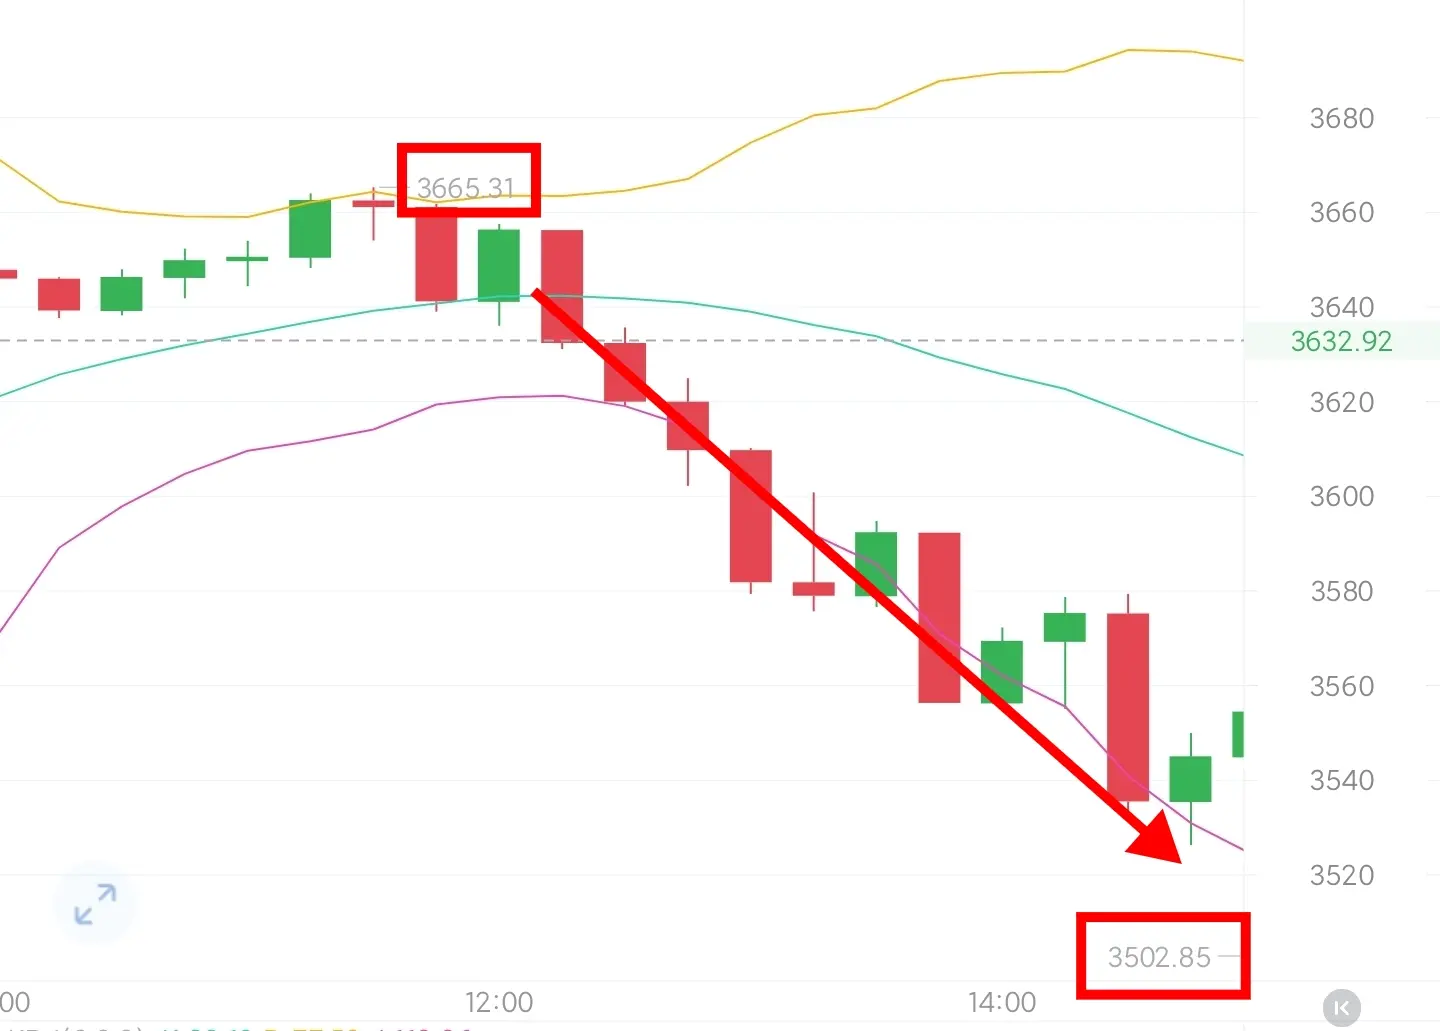
7.26 midday analysis
Bitcoin has formed a doji continuation signal on the weekly chart, which is often seen as an important signal for trend continuation in the market. Subsequently, it continued to break through the resistance level, temporarily encountering resistance around 117200. From an overall trend perspective, the current momentum for Bitcoin still appears solid without any fundamental changes. However, from the perspective of smaller timeframes, it has entered a correction phase. It is important to note that yesterday's pullback is of a corrective nature and does not indicate a trend
View OriginalBitcoin has formed a doji continuation signal on the weekly chart, which is often seen as an important signal for trend continuation in the market. Subsequently, it continued to break through the resistance level, temporarily encountering resistance around 117200. From an overall trend perspective, the current momentum for Bitcoin still appears solid without any fundamental changes. However, from the perspective of smaller timeframes, it has entered a correction phase. It is important to note that yesterday's pullback is of a corrective nature and does not indicate a trend
- Reward
- like
- Comment
- Share
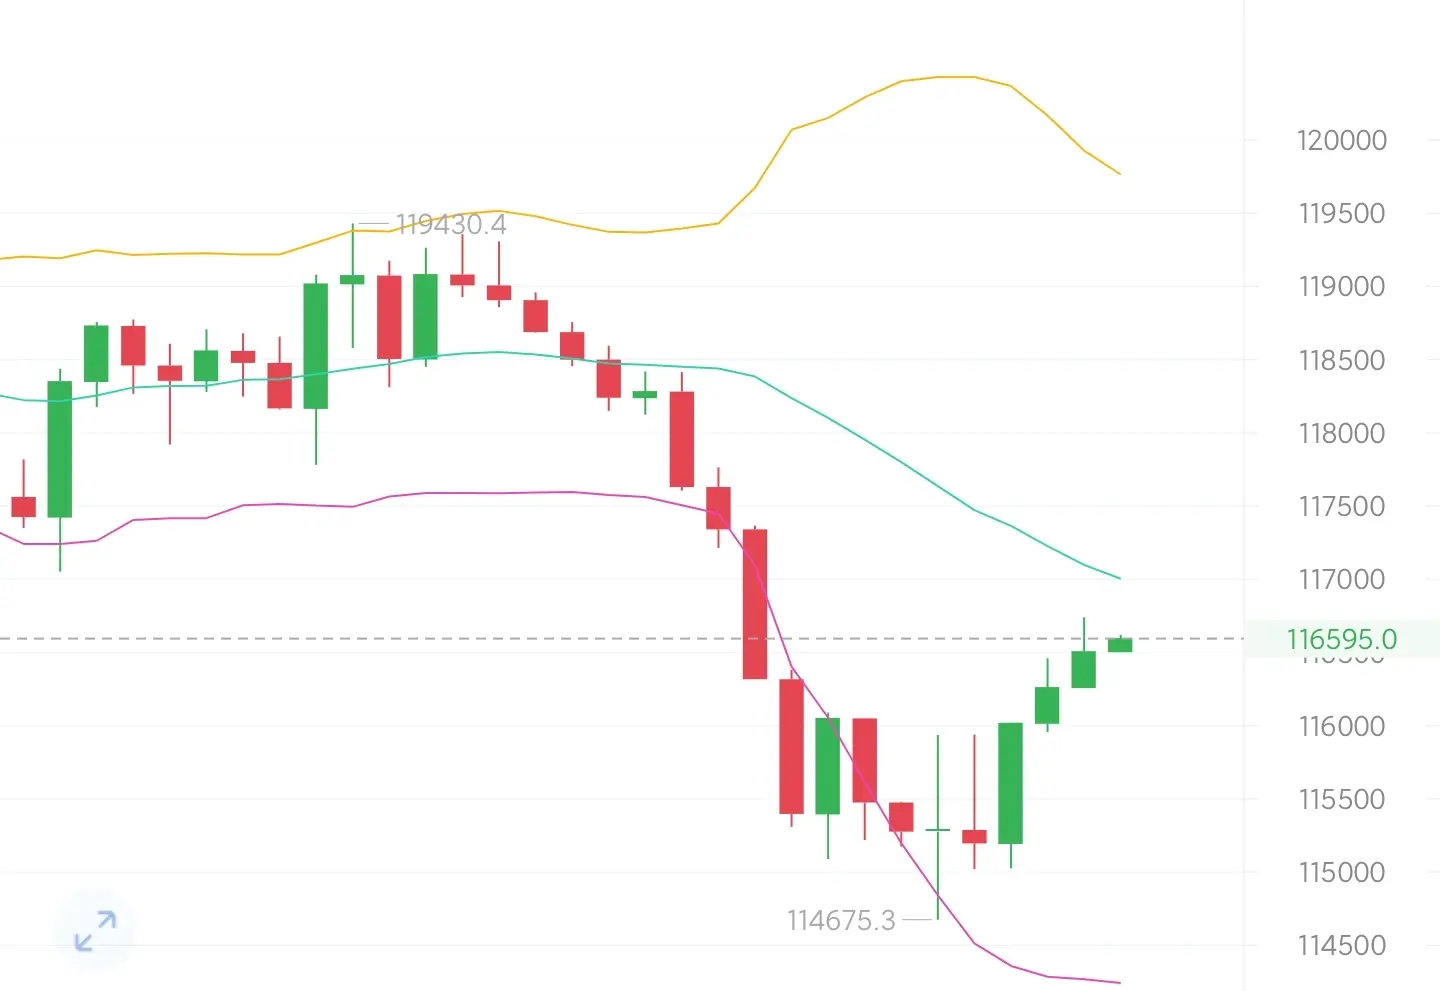
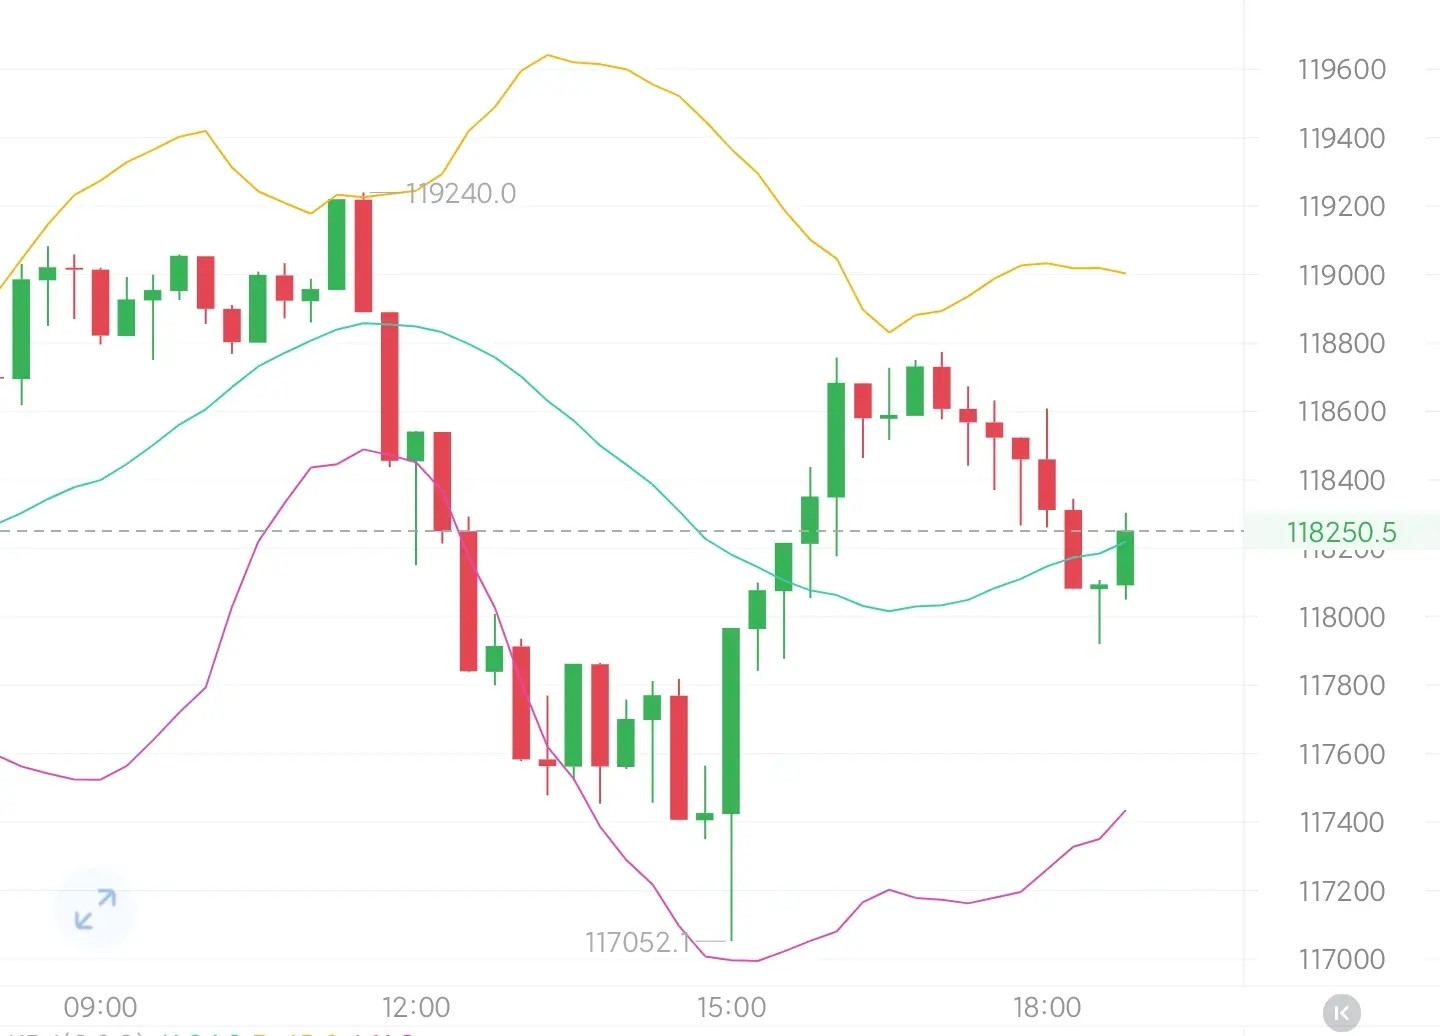
Evening analysis on July 25
Black Friday indeed lives up to its name. The daytime trend in Hangzhou continued into the early morning, returning from around 118400 to near 114800, and then immediately bouncing back to fluctuate around 116300.
From a four-hour perspective, although the strength of the KDJ is strong, it has closed with a bullish candle. In this case, pay attention to the resistance near 118200 above and the support near 110000 below.
Looking at the one-hour level again, the KDJ strength is ↓, pay close attention to the resistance around 117000 above, and watch for support aroun
BTC0.7%
- Reward
- 1
- Comment
- Share
Before the C position in May this year, the premium and discount status of gold prices on the two major domestic exchanges relative to the theoretical RMB gold price was consistent with the strength trend of international gold prices, reflecting that domestic gold market demand can have an effective impact on the international gold market.
After position C, the trend of gold price premiums and discounts in the two major domestic exchanges is completely opposite to the trend of international gold prices:
- CD interval: Domestic gold demand is weakening, while international demand is strengt
After position C, the trend of gold price premiums and discounts in the two major domestic exchanges is completely opposite to the trend of international gold prices:
- CD interval: Domestic gold demand is weakening, while international demand is strengt
BTC0.7%
- Reward
- like
- Comment
- Share
Is BlackRock really merging with Ripple? Is XRP going to da moon? Don't celebrate just yet!
Recently, the XRP community has been completely buzzing, with rumors spreading everywhere that "BlackRock is going to merge with Ripple, and XRP is about to soar." This rumor has instantly ignited the enthusiasm of cryptocurrency enthusiasts, and everyone is daydreaming about a new bull market for XRP. However, before blindly following the trend, we need to calm down and analyze the authenticity of this news in depth.
Where did the rumor come from? An on-chain analyst named Atlas published an articl
View OriginalRecently, the XRP community has been completely buzzing, with rumors spreading everywhere that "BlackRock is going to merge with Ripple, and XRP is about to soar." This rumor has instantly ignited the enthusiasm of cryptocurrency enthusiasts, and everyone is daydreaming about a new bull market for XRP. However, before blindly following the trend, we need to calm down and analyze the authenticity of this news in depth.
Where did the rumor come from? An on-chain analyst named Atlas published an articl

- Reward
- 1
- Comment
- Share
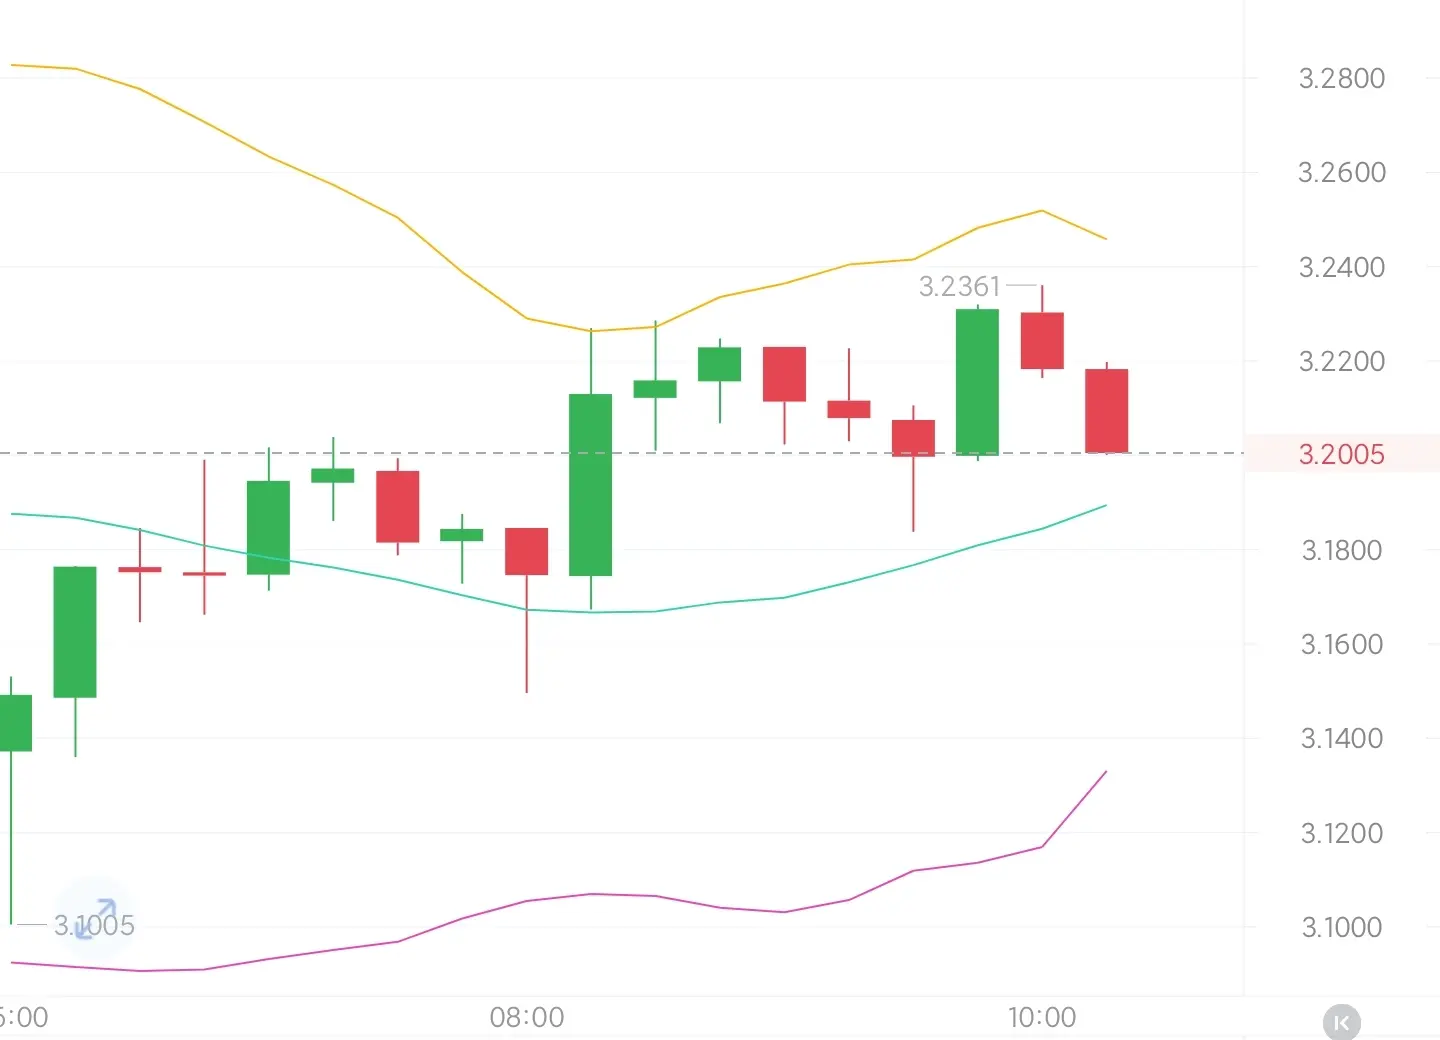
Since XRP started from the low near 2.23, it has risen over 60% in this phase. Yesterday, there was a pullback of about 20%, which is normal in the fluctuation of alts and does not require excessive interpretation. The key point to follow is whether the weekly line can hold above 3.2. If this level is maintained, there will still be opportunities to move upwards along the converging structure, aiming for 4.8, especially when mainstream funds are flowing back from BTC.
The current key level for DOGE is around 0.35. The current adjustment is mainly influenced by the overall market siphoning ef
View OriginalThe current key level for DOGE is around 0.35. The current adjustment is mainly influenced by the overall market siphoning ef
- Reward
- like
- Comment
- Share
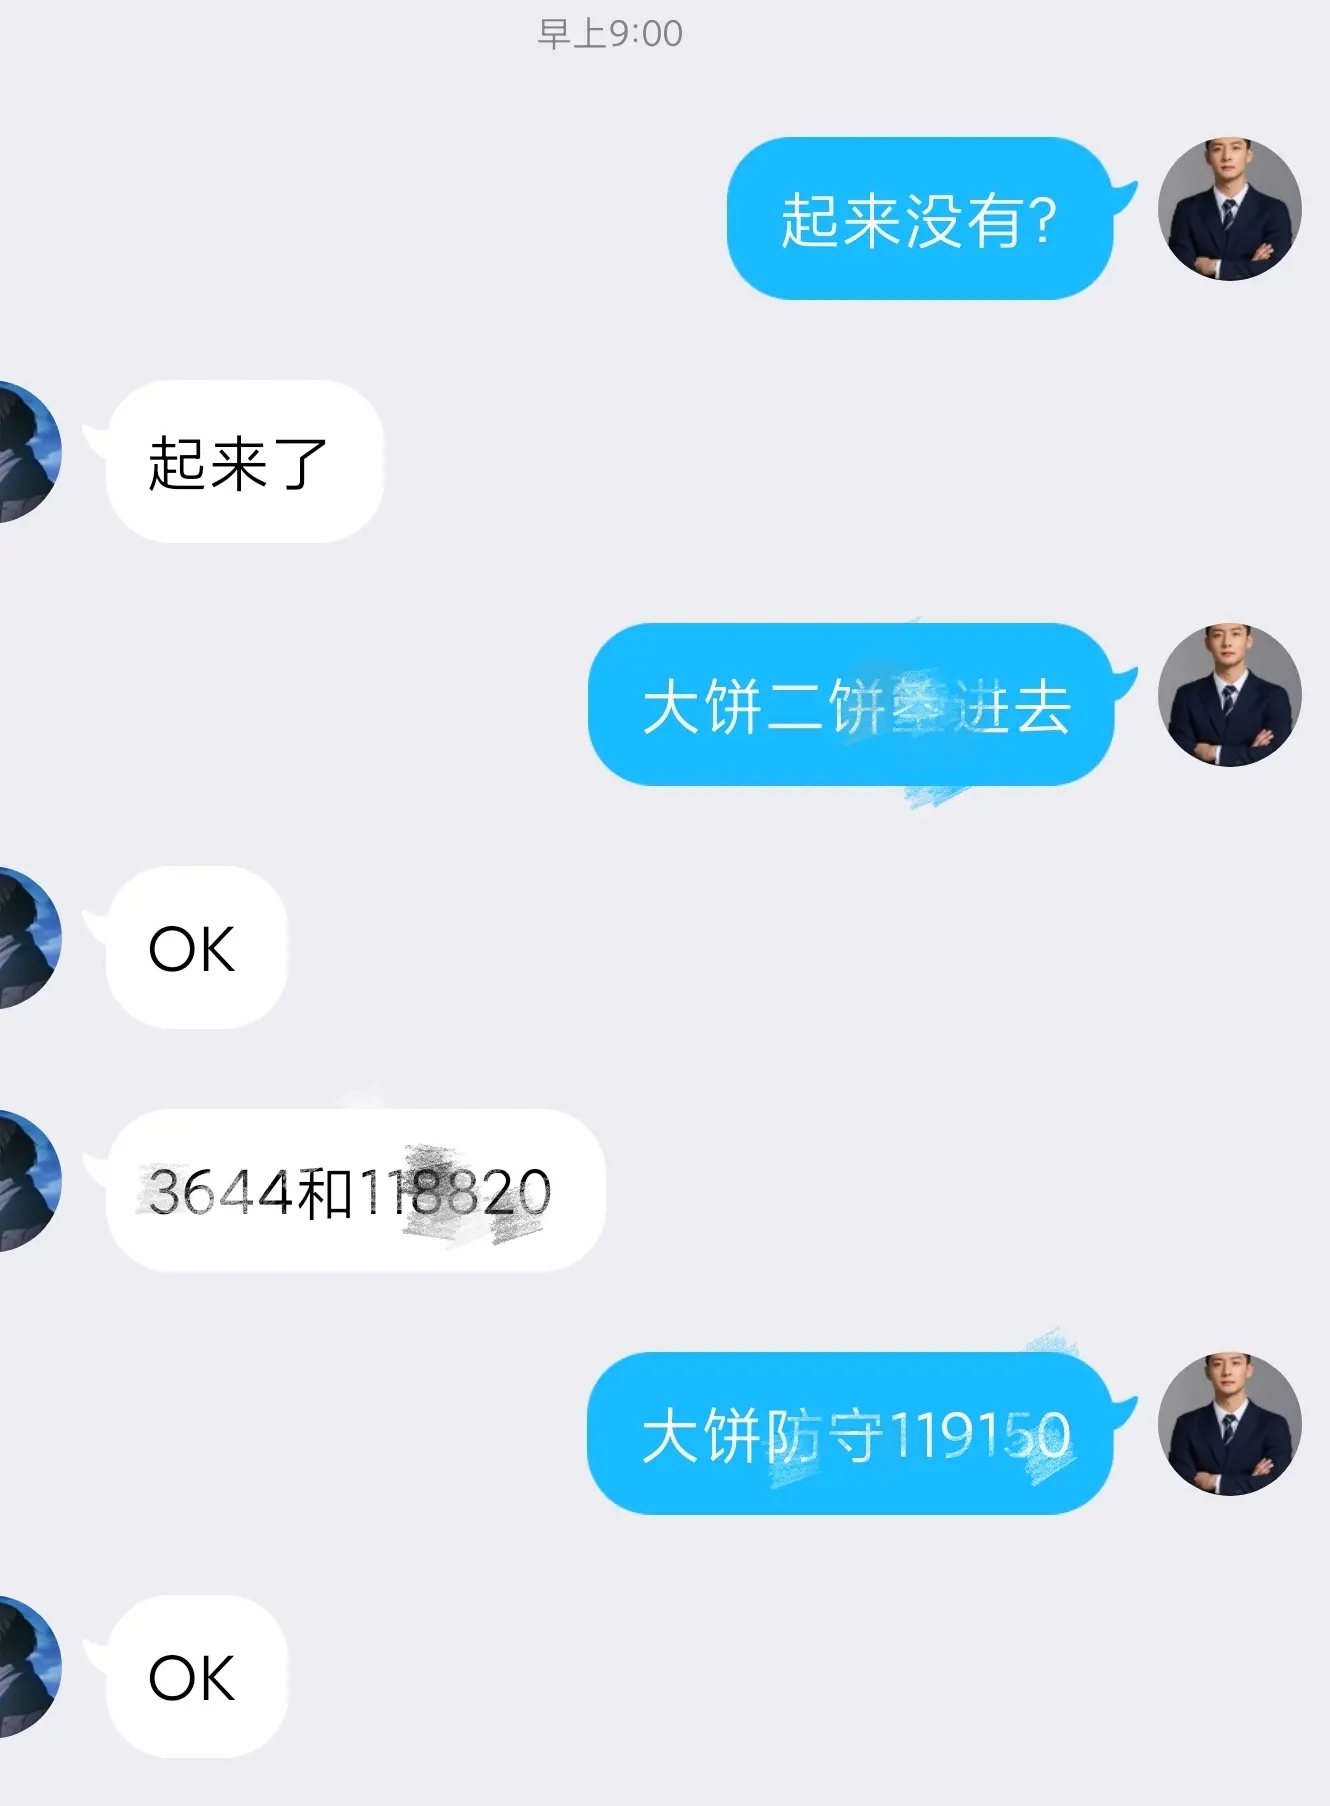
[Rolling Warehouse Plan, officially launched]
What is rolling warehouse? The term "rolling" is familiar to everyone. From now on, Chang'an will turn your 🔥🔥1 pancake into 2 pancakes, 2 into 4, 4 into 8, and 8 into 16. Until Chang'an is satisfied. 🔥🔥
Friends with 5000💰 or more, please stay: Keep your heart steady, leave the rest to me💪🏻
From now on, you don't have to stay up all night staring at the market👀, nor do you need to guess the trading patterns yourself🤔.
Starting from 5000💰, I will control the display, and I will capture the timing.
You work and live as usual😍, just make s
BTC0.7%

- Reward
- like
- 1
- Share
ForeverRich :
:
How to joinAnalysis at 7:25 AM
The daily chart of Bitcoin shows a continuous decline, testing the support below yesterday's low. Initially, it made a rebound but then formed a bottoming reversal pattern. Currently, the daily chart is showing a medium bearish doji candlestick. The price is currently consolidating with a shrinking volatility, and in the short term, it is still unable to break out of a strong trend. The price is oscillating widely within the range, with a significant amplitude, which challenges the entry points of the trading strategy. We remain unchanged in our view; following the trend an
The daily chart of Bitcoin shows a continuous decline, testing the support below yesterday's low. Initially, it made a rebound but then formed a bottoming reversal pattern. Currently, the daily chart is showing a medium bearish doji candlestick. The price is currently consolidating with a shrinking volatility, and in the short term, it is still unable to break out of a strong trend. The price is oscillating widely within the range, with a significant amplitude, which challenges the entry points of the trading strategy. We remain unchanged in our view; following the trend an
BTC0.7%
- Reward
- like
- Comment
- Share
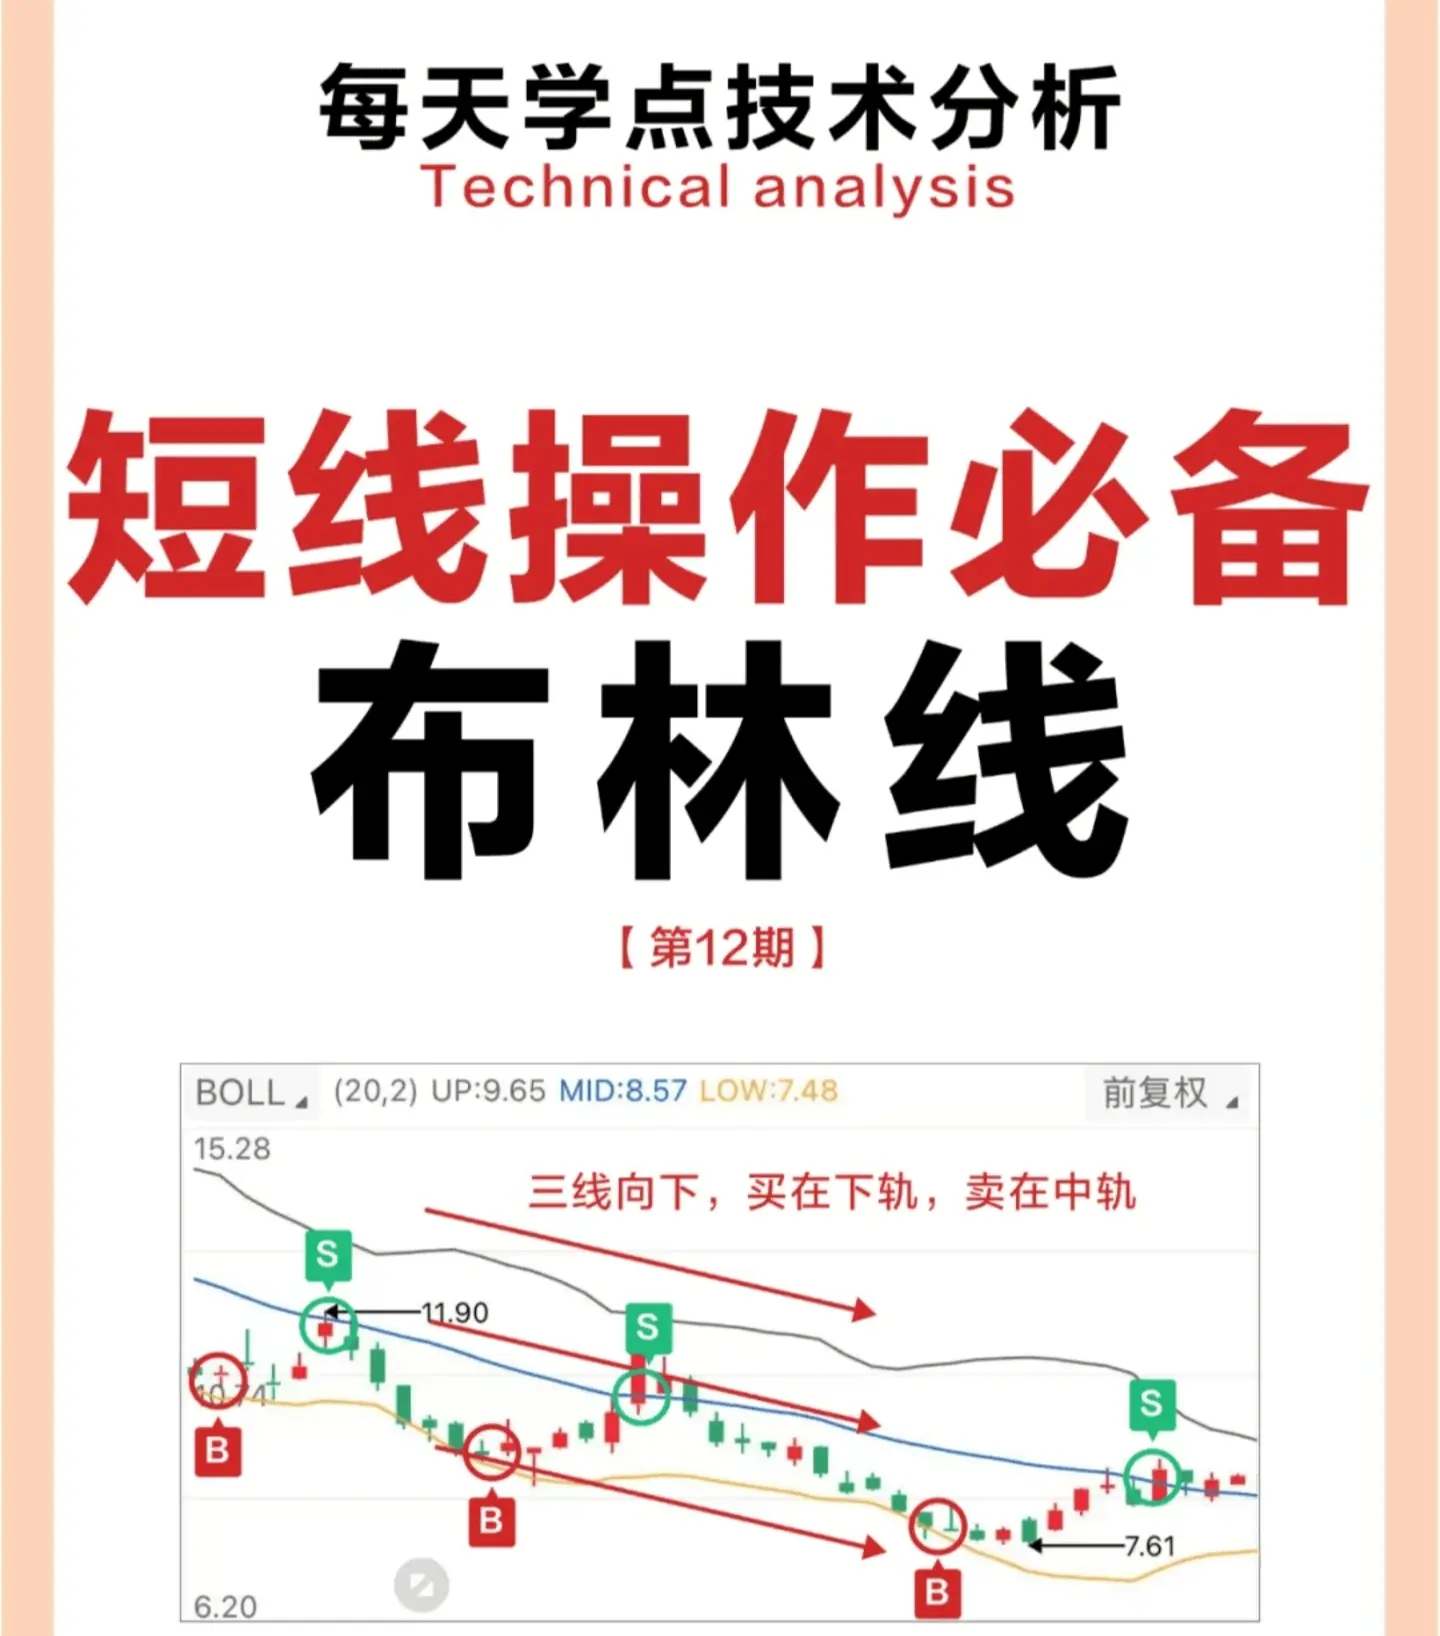
Bollinger Bands: A powerful tool to break through the Sideways dilemma, a key signal before the market turning point.
Sideways market conditions are always frustrating: prices drop after buying and rise after selling. However, the Bollinger Bands can predict market turning points in advance - they act like a rubber band, brewing significant volatility when they narrow and providing clear action signals when they widen!
When the Bollinger Bands narrow to almost sticking together, it means a significant change is imminent.
When the price is moving sideways, the upper, middle, and lower bands
BTC0.7%
- Reward
- like
- Comment
- Share
- Reward
- like
- Comment
- Share
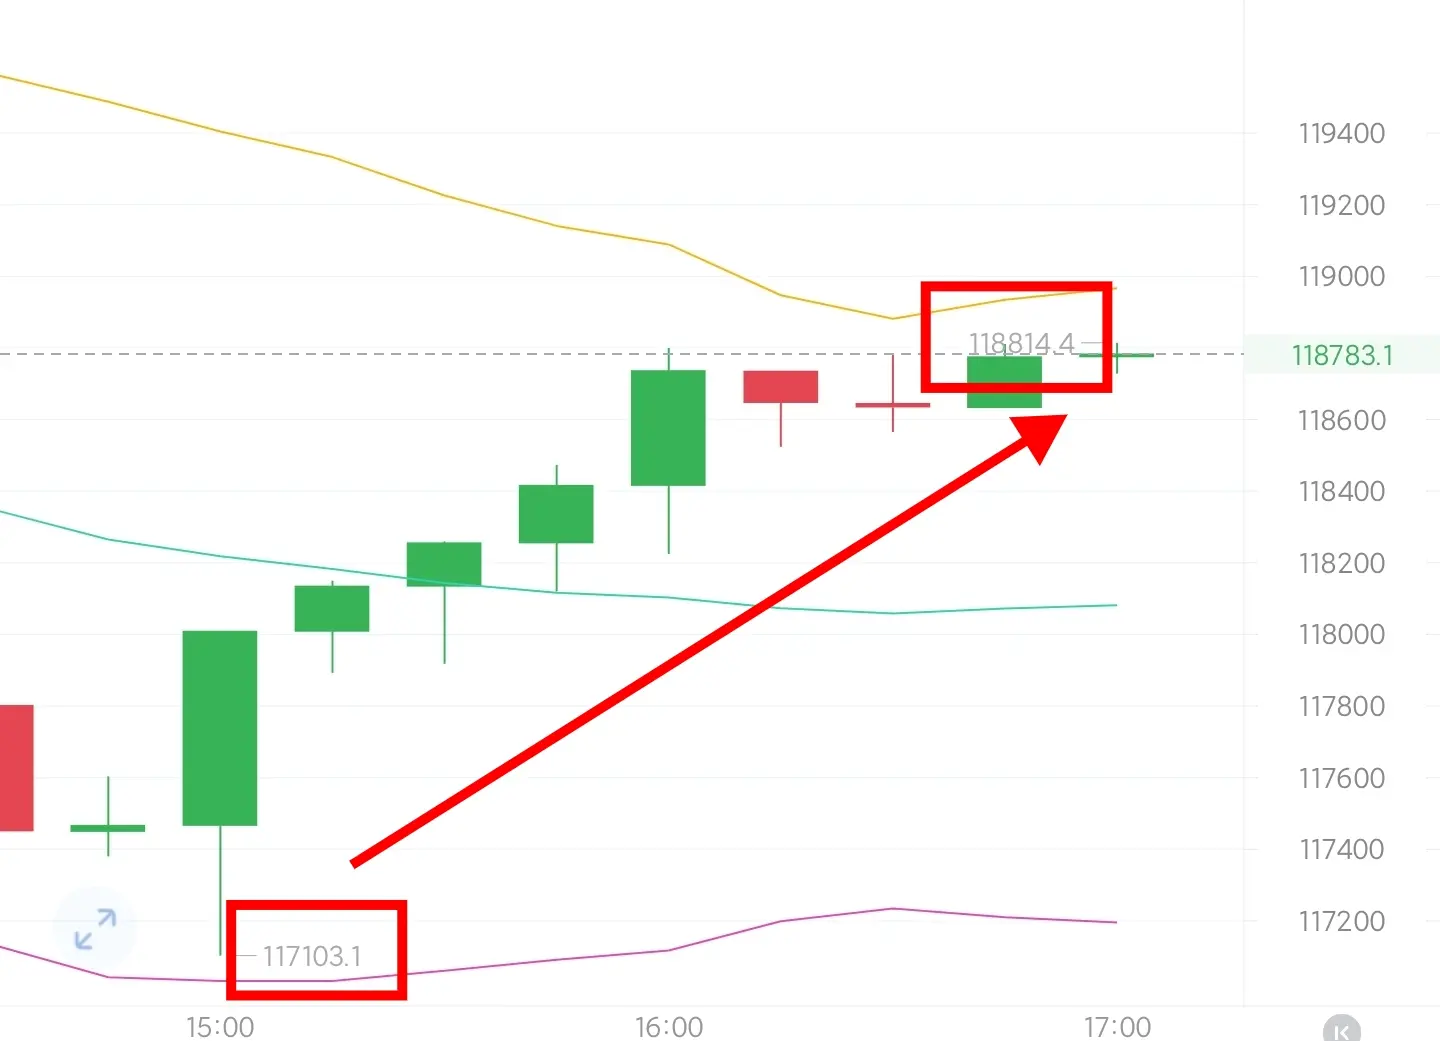
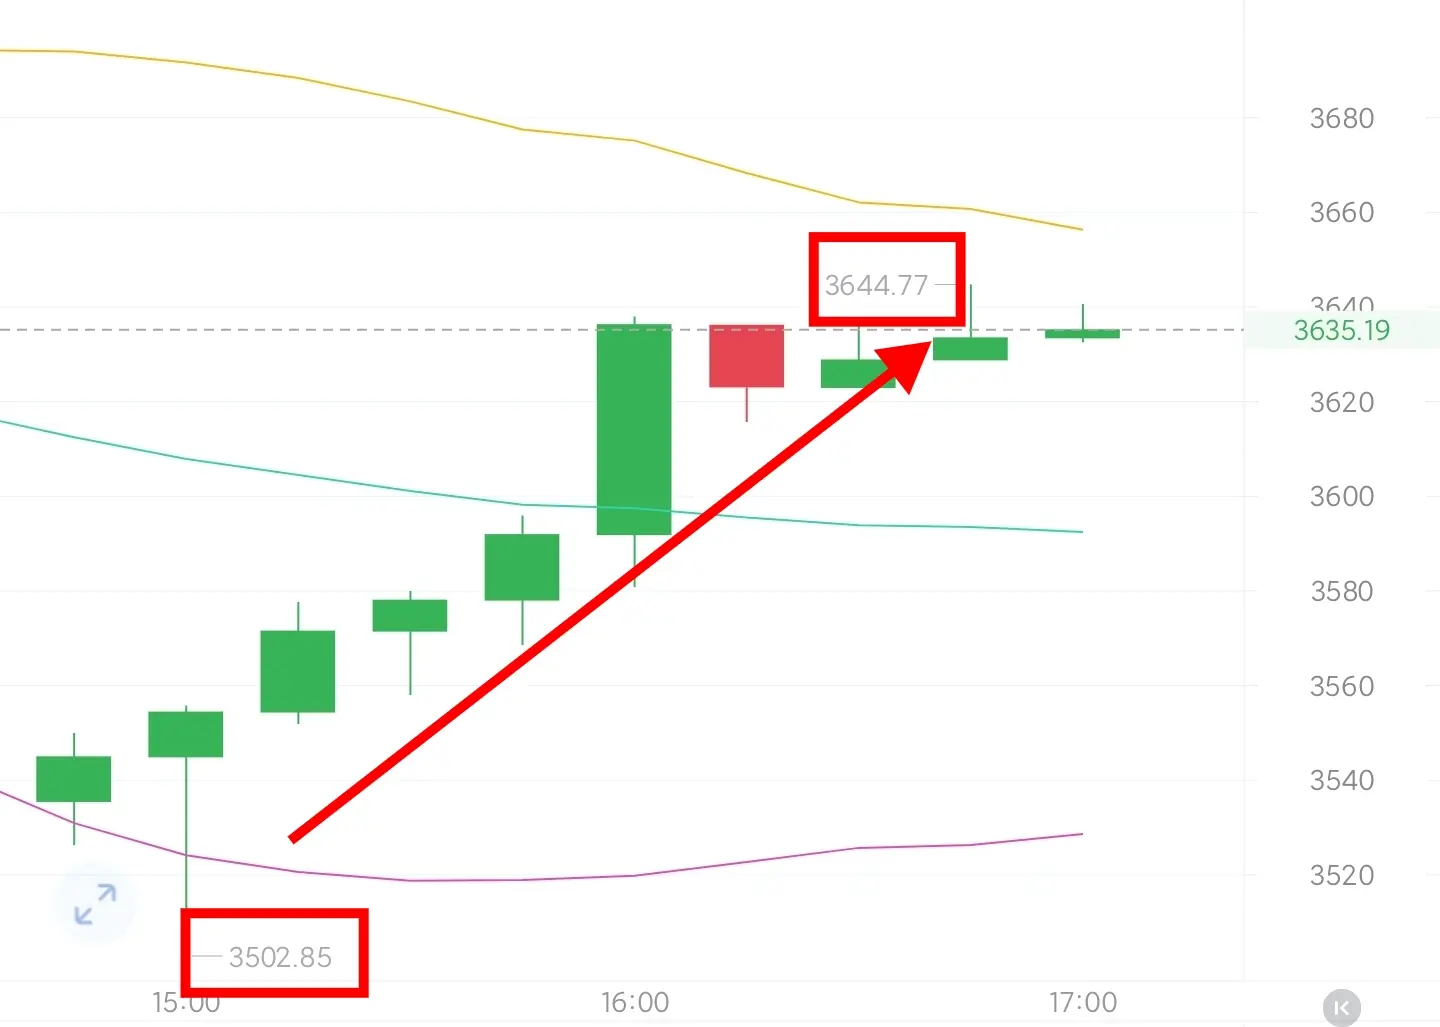
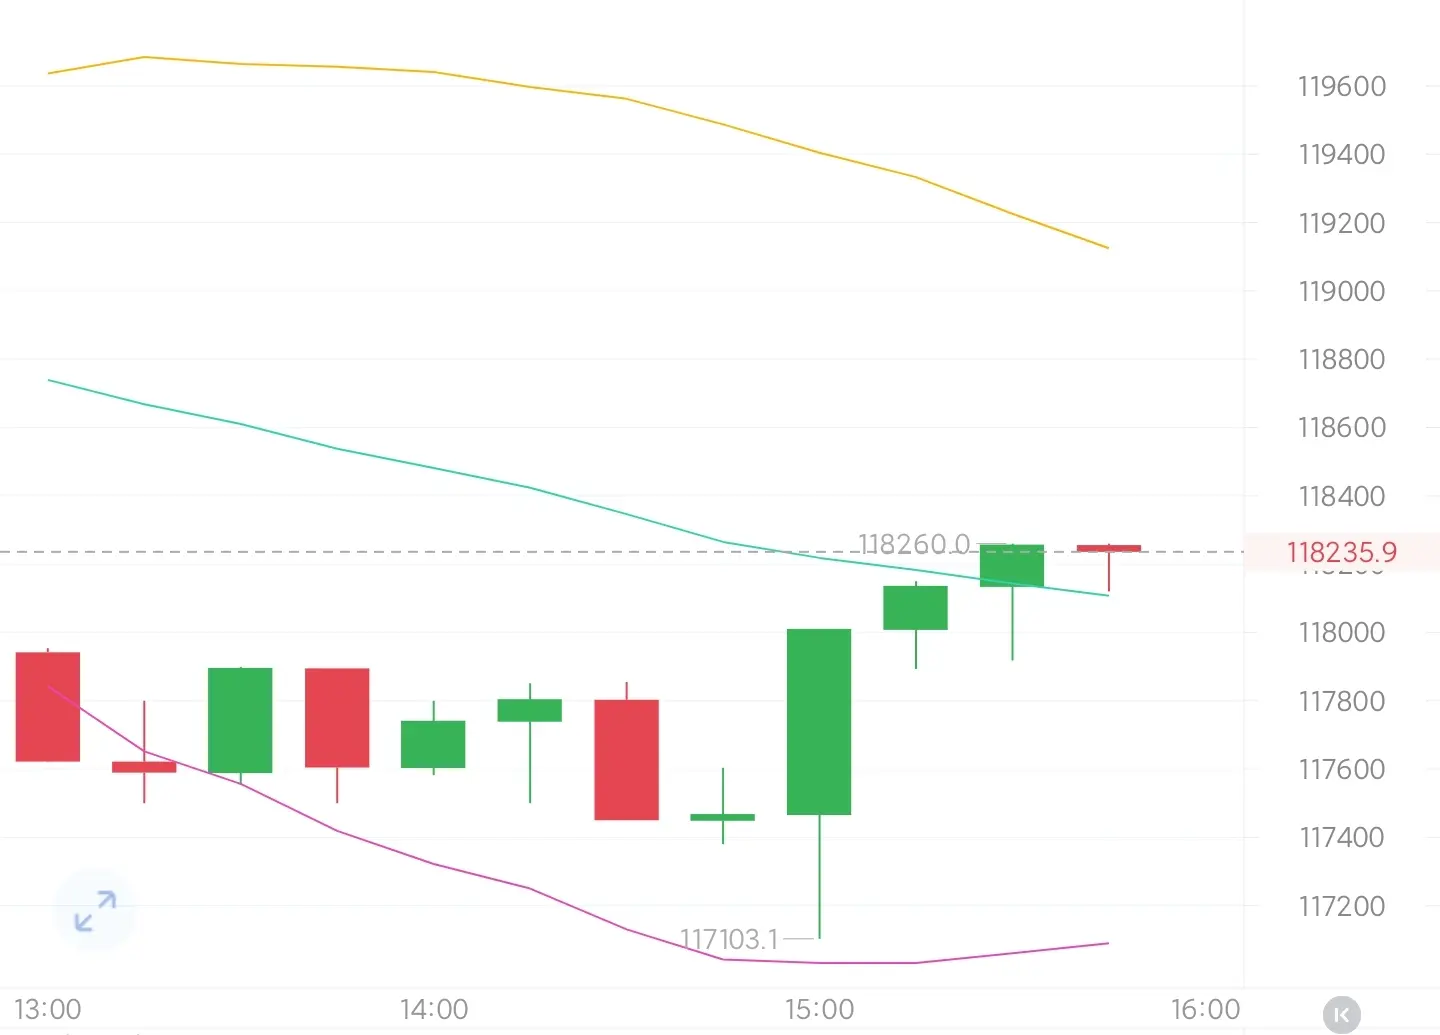
Evening of July 24
The midday pancake rebounded to 118790 after hitting the bottom at 117050. Currently, it is still in a wide range of fluctuations.
The evening Hangqing has weakened the downward trend, with limited downward force. The market is currently gathering strength, and it would be more prudent to enter the market after breaking through the resistance level.
Suggestion:
Bitcoin: Fluctuating around 117700-117100, target near 118500-119200.
The second pie: around 3580-3550, target around 3650-3680 #BTC#
BTC0.7%
- Reward
- like
- Comment
- Share
Why shouldn't a young man dream of plucking stars, daring to draw the mulberry bow and shoot the jade balance?
Just chase, oscillating pattern, hit the bamboo shoots when you can, if you have bullets, why are you hesitating? Are you saving the bullets to shoot yourself?
Just chase, oscillating pattern, hit the bamboo shoots when you can, if you have bullets, why are you hesitating? Are you saving the bullets to shoot yourself?
BTC0.7%

- Reward
- like
- Comment
- Share
- Reward
- like
- Comment
- Share
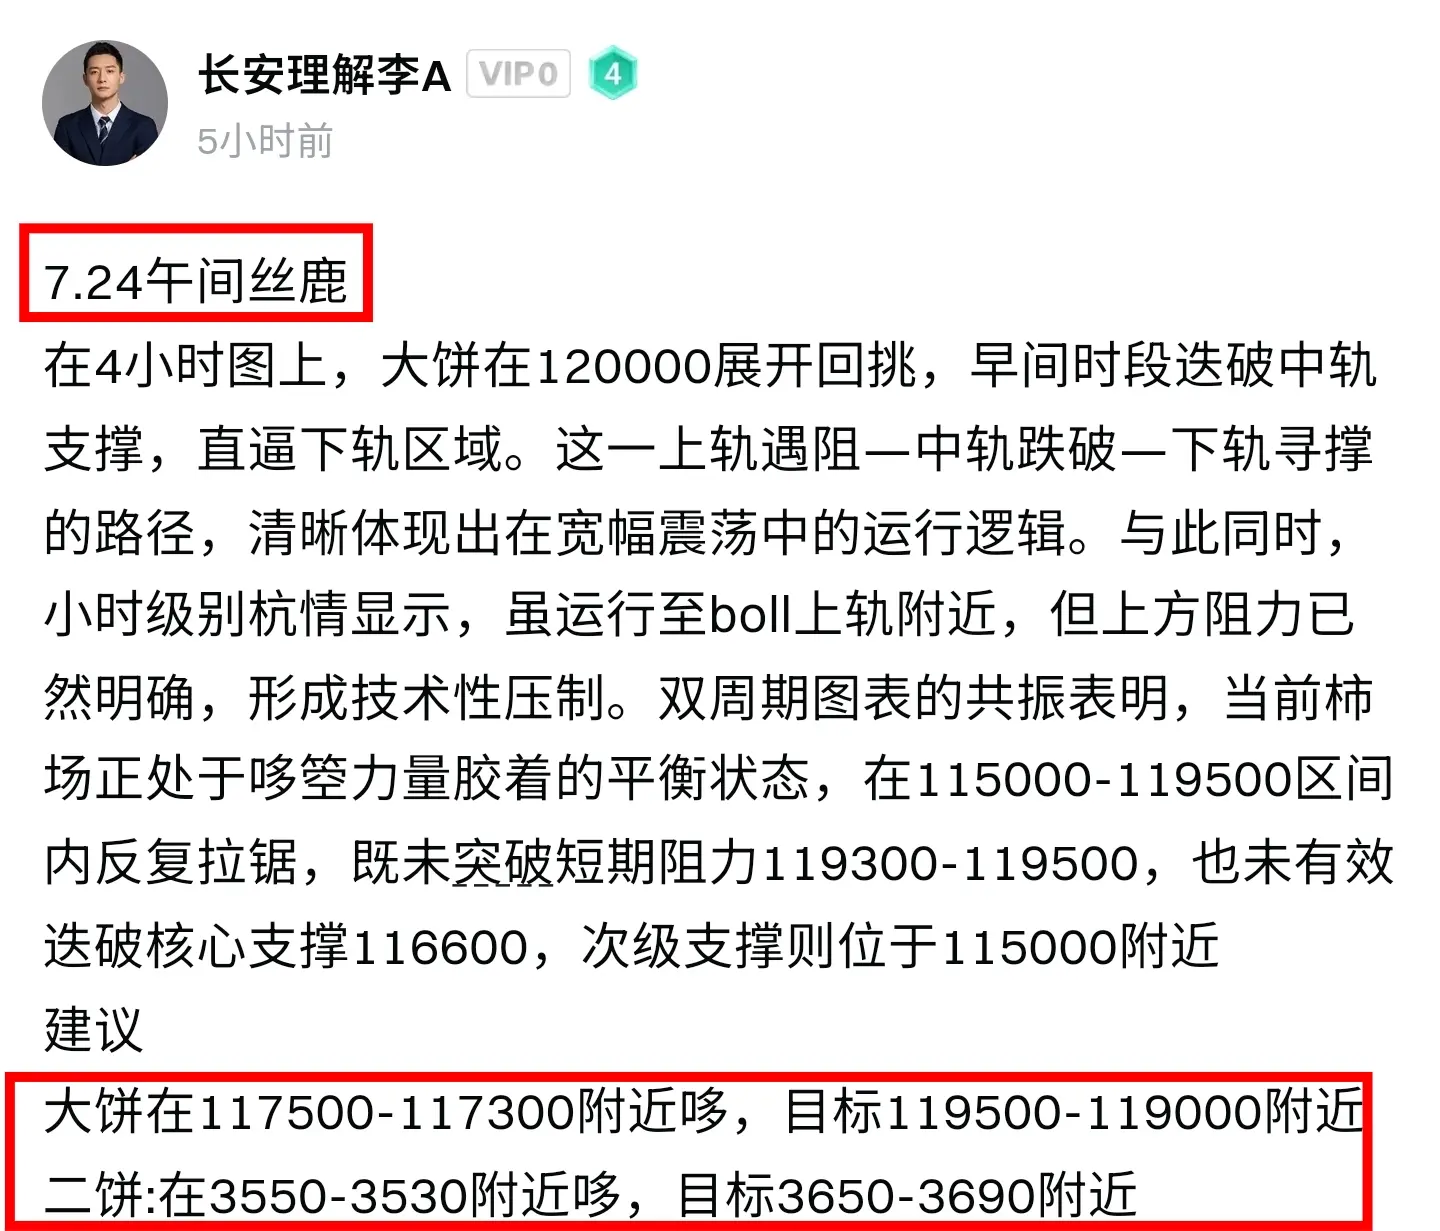
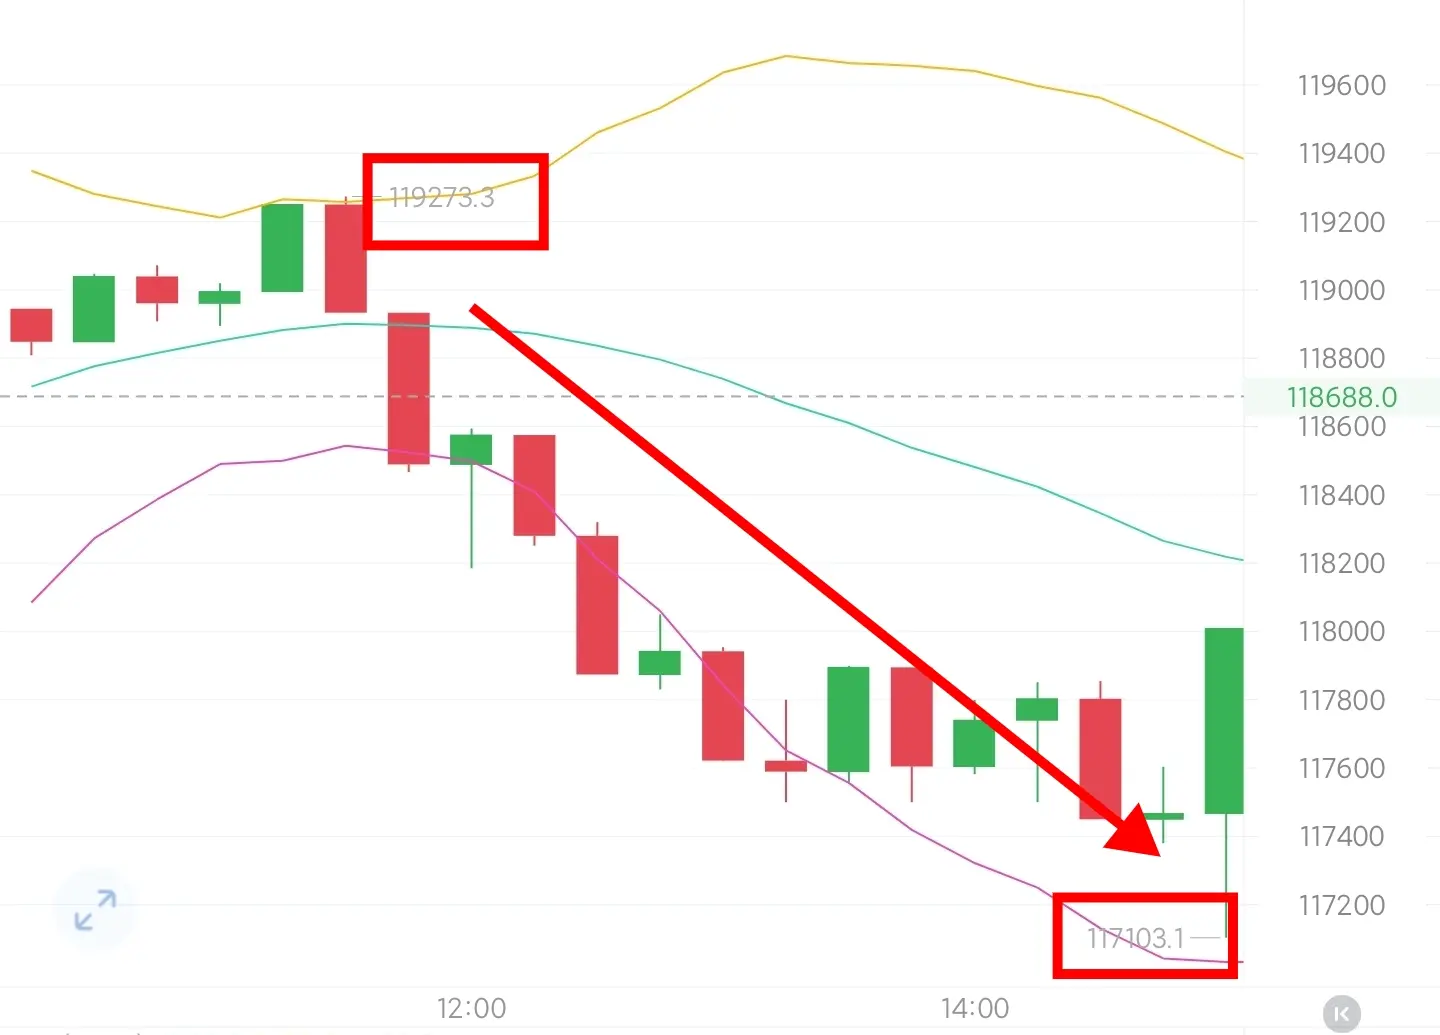
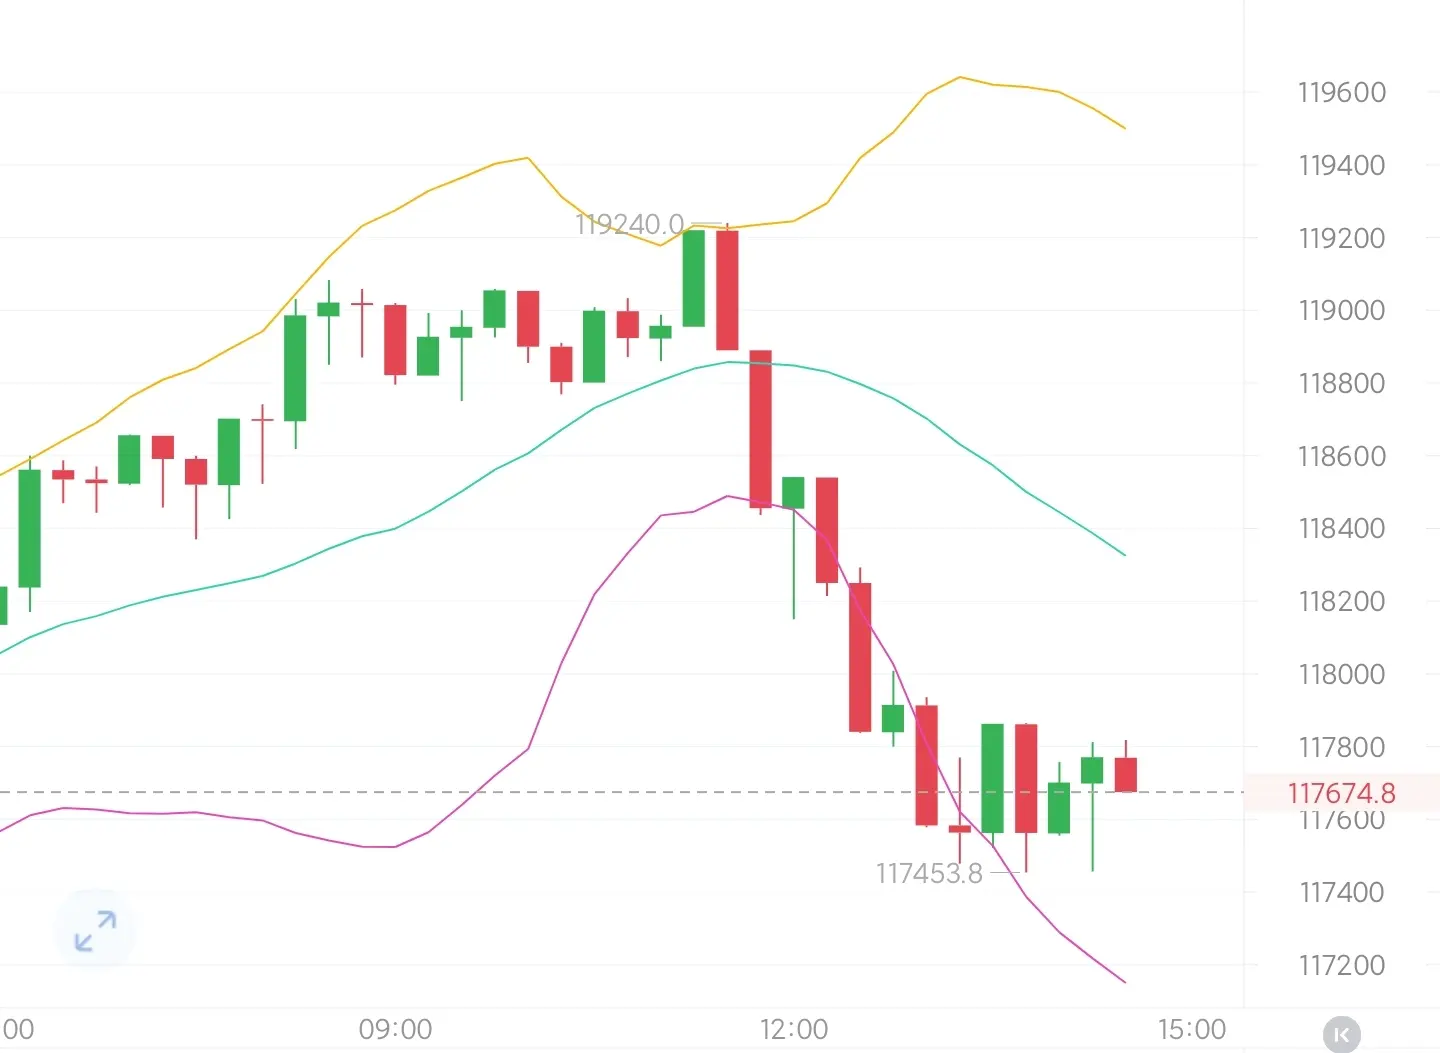
7.24 midday silk deer
On the 4-hour chart, Bitcoin is experiencing a pullback around 120000. During the morning session, it broke through the middle track support, approaching the lower track area. The path of encountering resistance at the upper track—breaking through the middle track—seeking support at the lower track clearly reflects the operational logic in a wide range of fluctuations. Meanwhile, the hourly level shows that although it is running near the upper Bollinger Band, the resistance above is already clear, forming technical pressure. The resonance of the dual time frame charts in
On the 4-hour chart, Bitcoin is experiencing a pullback around 120000. During the morning session, it broke through the middle track support, approaching the lower track area. The path of encountering resistance at the upper track—breaking through the middle track—seeking support at the lower track clearly reflects the operational logic in a wide range of fluctuations. Meanwhile, the hourly level shows that although it is running near the upper Bollinger Band, the resistance above is already clear, forming technical pressure. The resonance of the dual time frame charts in
BTC0.7%
- Reward
- like
- Comment
- Share
- Reward
- like
- Comment
- Share