Glassnode
vip
Age2.4Year
Peak Tier0
No content yet
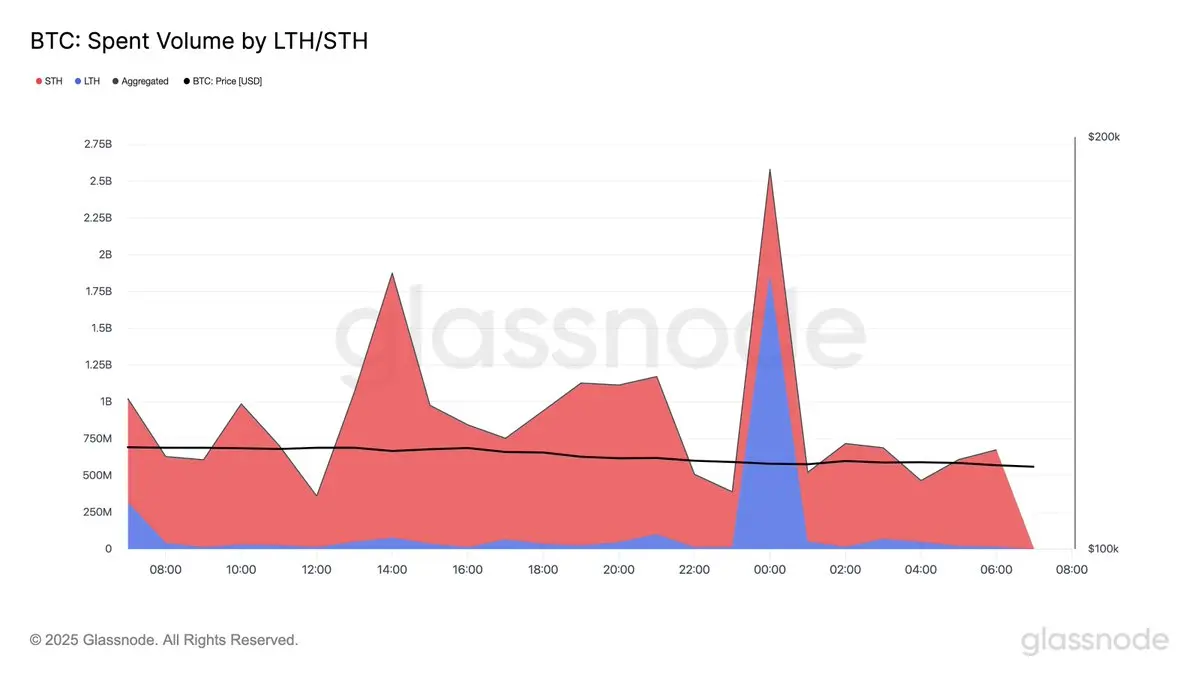
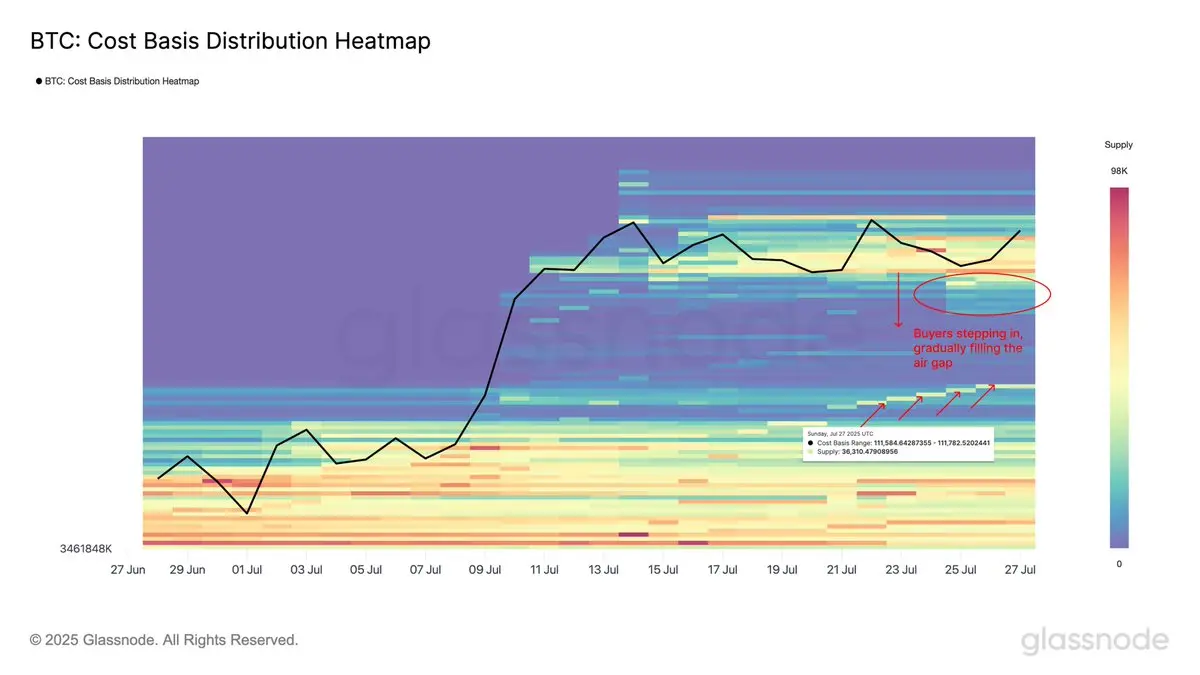
Over the past 24 hours, the vast majority of $BTC spent volume came from Short-Term Holders (STH):
🔸STH: $18.24B (85.5%)
🔸LTH: $3.10B (14.5%)
🔸Total spent: $21.34B
This suggests the sell-off is primarily driven by recent buyers rather than long-term investors.
BTC-1.51%
post-image
  • Reward
  • Comment
  • Share
Despite $BTC down -3.2% and $ETH -6%, liquidations remain low ($110M/$132M) and OI drawdowns are modest. This move looks more like spot-driven selling than a derivatives flush. No signs of a leverage cascade yet.
BTC-1.51%
ETH-4.95%
MOVE-1.68%
LOOKS12.95%
post-image
  • Reward
  • Comment
  • Share
A composite index of age-based cohorts shows most new #Bitcoin# holders remain in profit. With the index trending toward +1σ, market momentum remains broadly constructive.
BTC-1.51%
  • Reward
  • Comment
  • Share
$BTC remains above all STH sub-cohort cost bases (24hrs–3m range: $110K–$117K). This alignment with the light-volume zone suggests strong underlying support in the event of a pullback.
BTC-1.51%
post-image
  • Reward
  • Comment
  • Share
Despite $ETH trading near its March 2024 highs, unrealized profits are far lower. Back then, #ETH# hit +2σ (standard deviations) on Relative Unrealized Profit at $3.98K - today it's just nearing +1σ. A move to +2σ now would imply ~$4.9K $ETH.
ETH-4.95%
MOVE-1.68%
post-image
  • Reward
  • Comment
  • Share
#Bitcoin# 's Unrealized Profit as a percentage of Market Cap broke above the +2σ band, a level historically tied to euphoric phases. The setup mirrors previous ATH environments, reinforcing latent sell-side pressure.
BTC-1.51%
BAND-1.37%
post-image
  • Reward
  • Comment
  • Share
Total unrealized profit of all $BTC holders hit a new high of $1.4T. This massive paper gain concentration sets the stage for potential future distribution pressure if prices continue higher.
BTC-1.51%
STAGE-6.34%
post-image
  • Reward
  • Comment
  • Share
#Bitcoin# Long-Term Holders - investors who held for 155 day or more - still command 53% of supply despite recent distribution. The enduring concentration signals more supply could unlock if price rises - requiring sustained demand to absorb it.
BTC-1.51%
MORE0.32%
post-image
  • Reward
  • Comment
  • Share
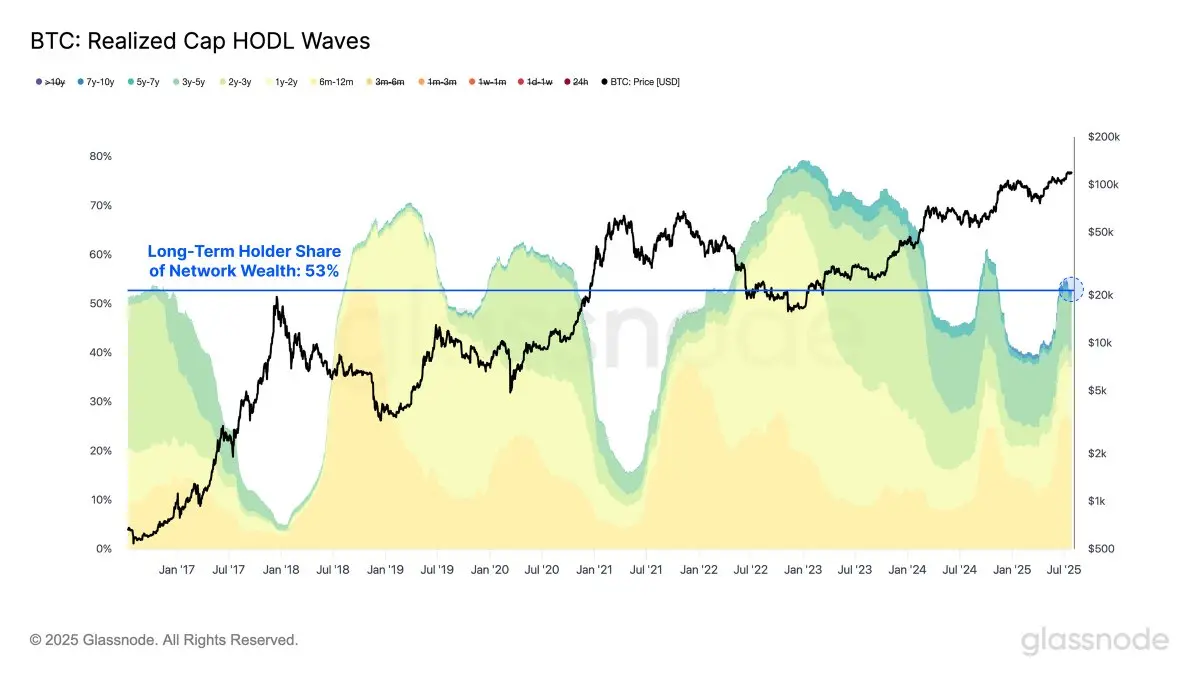
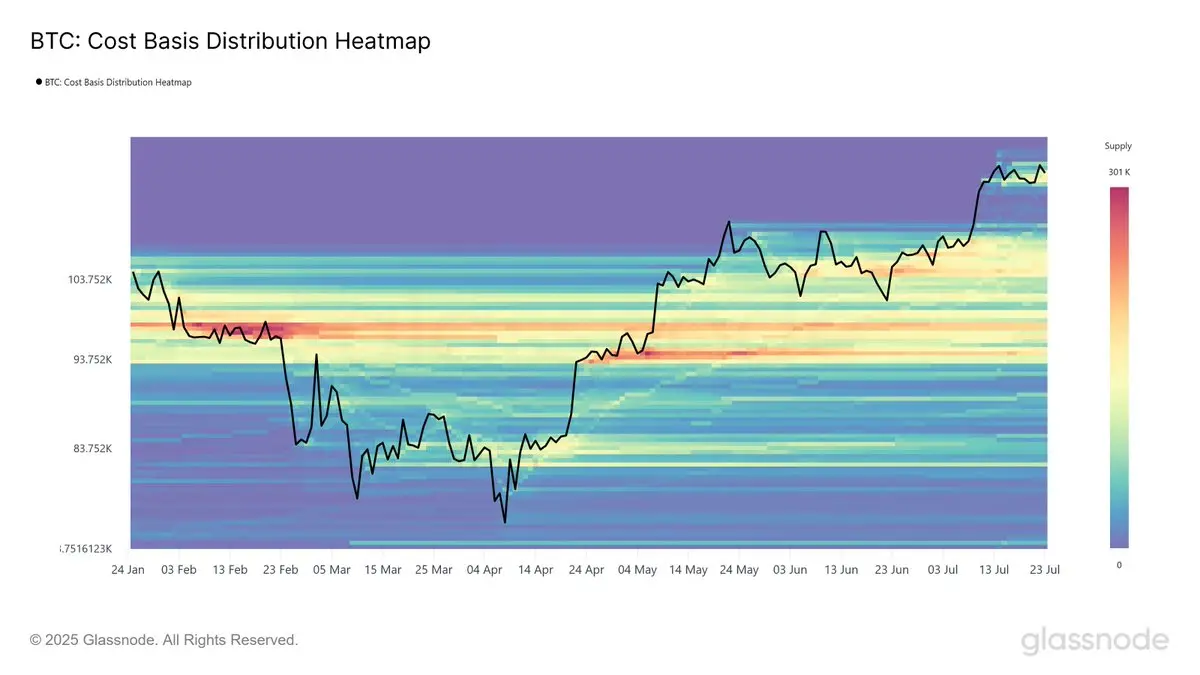
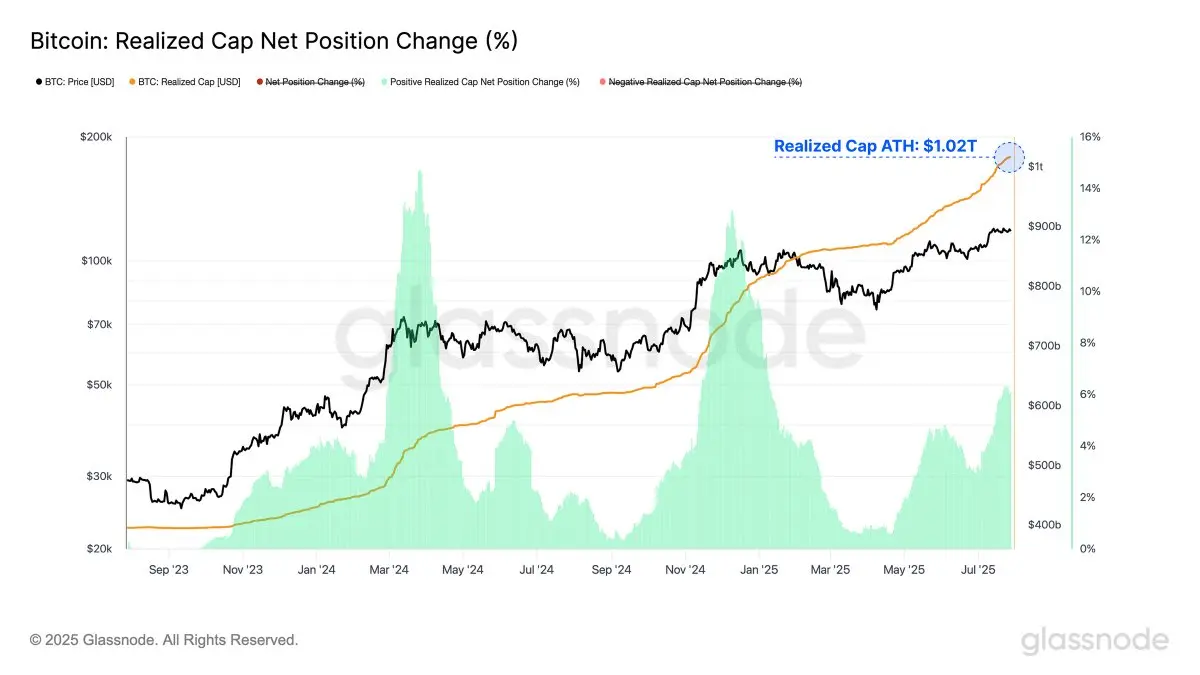
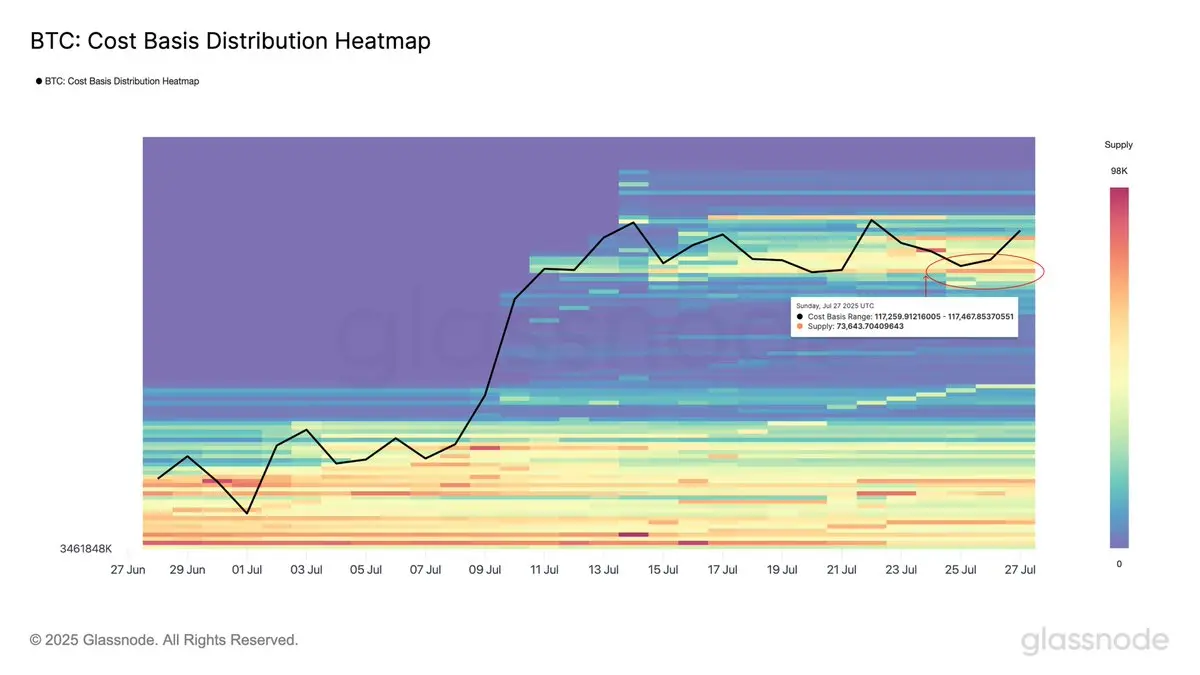
The LTH/STH Supply Ratio - comparing $BTC supply held by long-term investors to new entrants - dropped -11% over 30 days, reflecting continued rotation into distribution. This pattern has preceded prior ATHs and highlights a structurally consistent shift in investor positioning.
BTC-1.51%
  • Reward
  • Comment
  • Share
#Bitcoin# absorbed a $9.6B sell-off over the weekend as 80k BTC moved via OTC desks. Yet, the market impact was minimal - showcasing deep liquidity and structural resilience. Read the latest Week On-Chain for full postmortem of this event:
BTC-1.51%
VIA-5.51%
DEEP-4.71%
post-image
post-image
post-image
post-image
  • Reward
  • Comment
  • Share
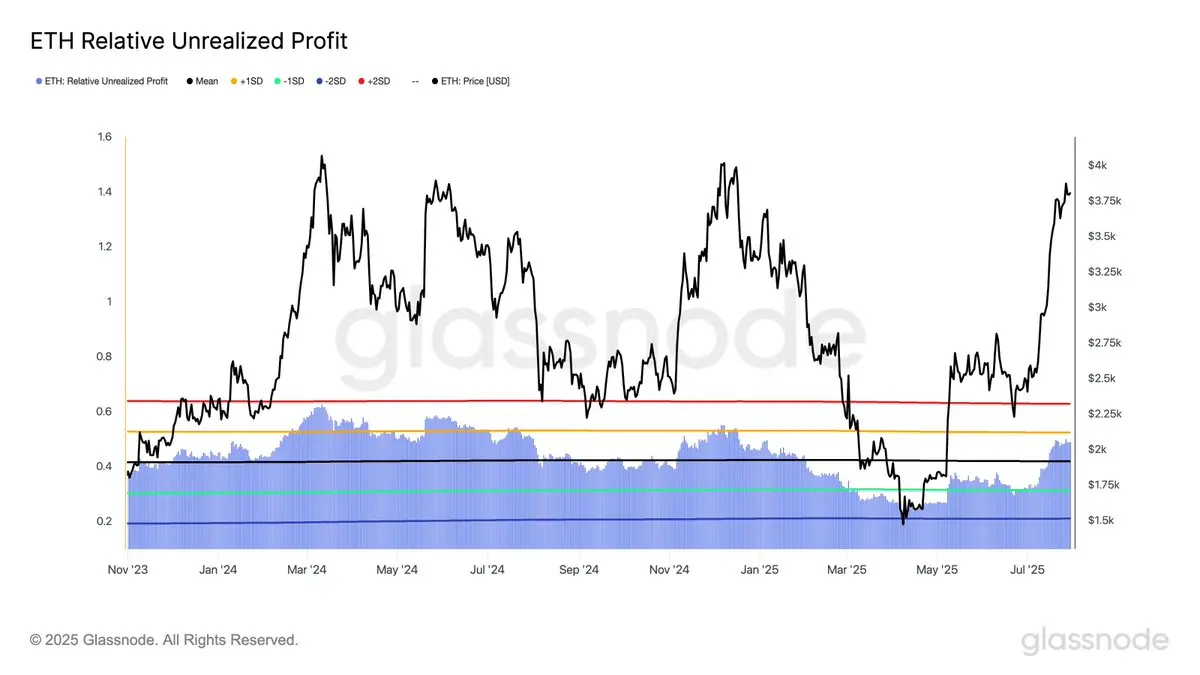
#ETH# ’s +1σ Active Realized Price band - currently at $4.5K - marks a key upside threshold for the current rally. This level acted as resistance in March 2024 and during the 2020–21 cycle. Breakouts above it often signal market euphoria and rising risk of structural instability.
ETH-4.95%
BAND-1.37%
T-1.66%
RLY-10.94%
  • Reward
  • Comment
  • Share
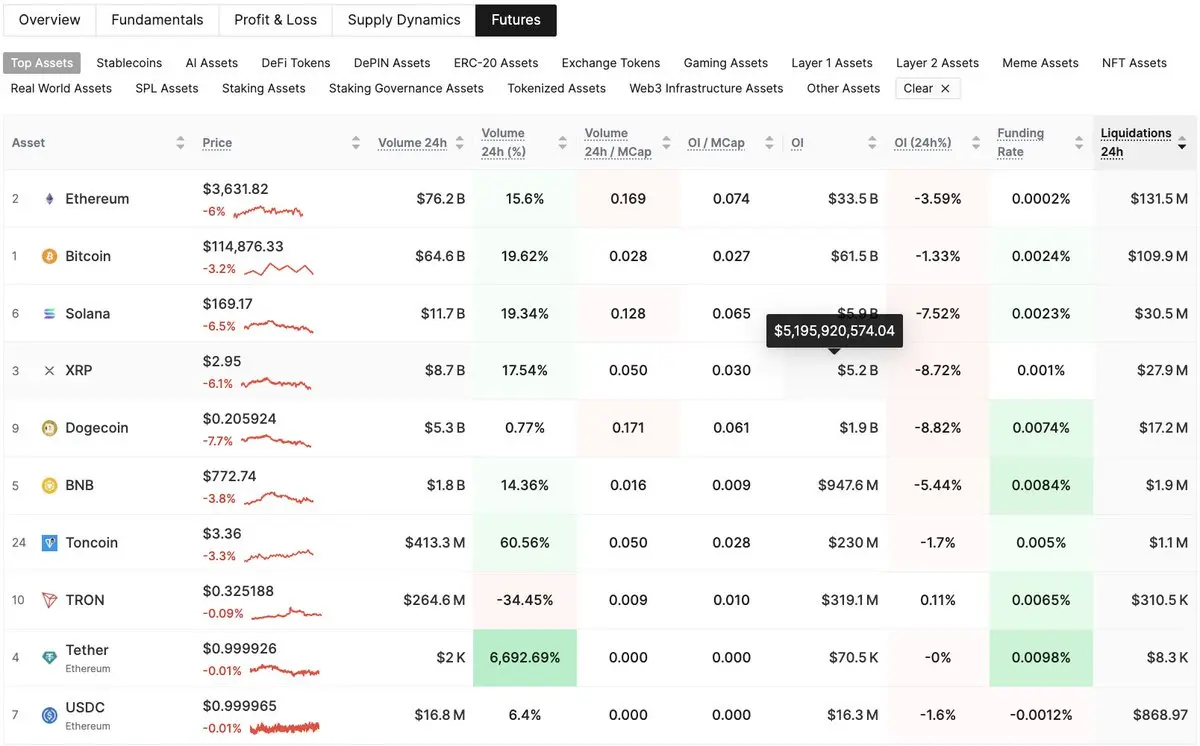
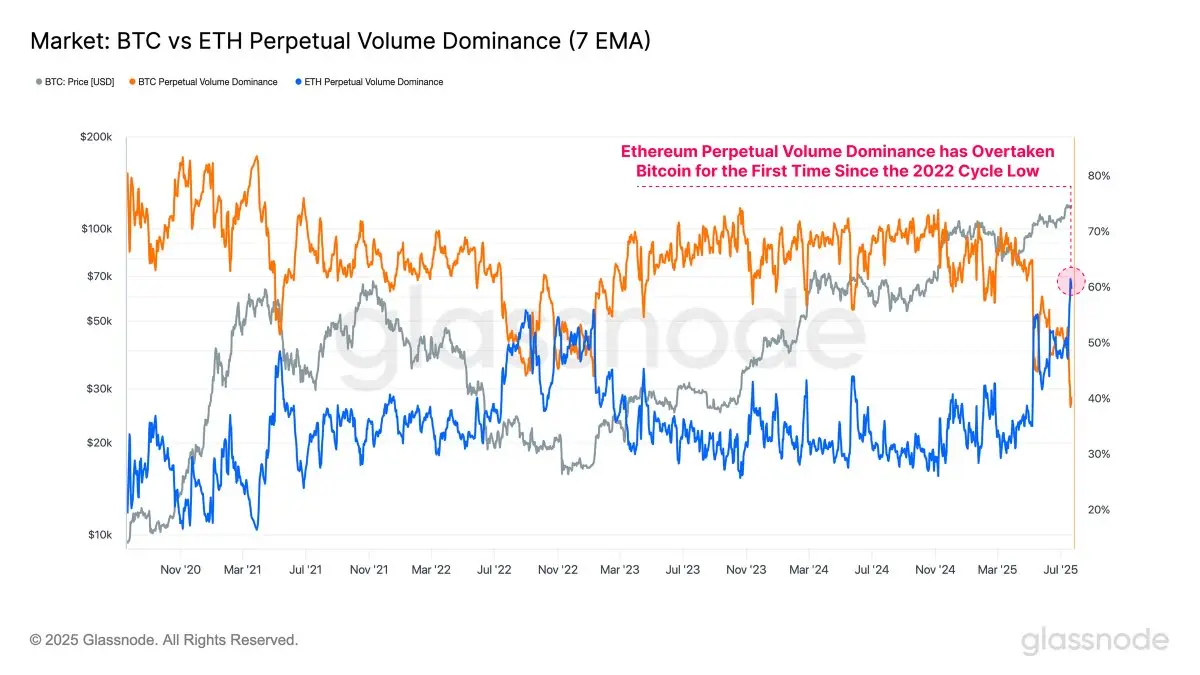
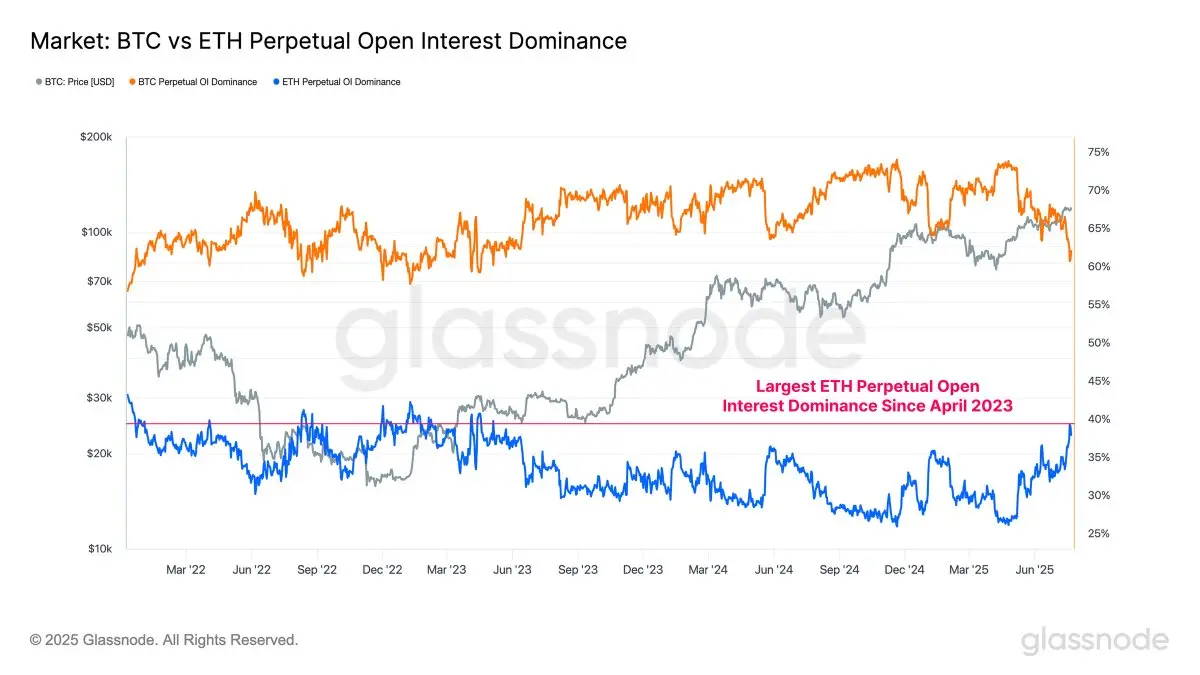
#Ethereum# perp volume dominance has recently overtaken #Bitcoin# for the first time since the 2022 cycle low - marking the largest volume skew in $ETH favor on record. This shift confirms a meaningful rotation of speculative interest toward the #altcoin# sector.
ETH-4.95%
BTC-1.51%
post-image
  • Reward
  • Comment
  • Share
#Ethereum# open interest dominance has climbed to nearly 40%, its highest level since April 2023. Only 5% of days have seen a higher reading. This marks a clear shift in speculative focus, with capital rotating from $BTC to $ETH at the margin.
ETH-4.95%
CLEAR-5.71%
BTC-1.51%
post-image
  • Reward
  • Comment
  • Share
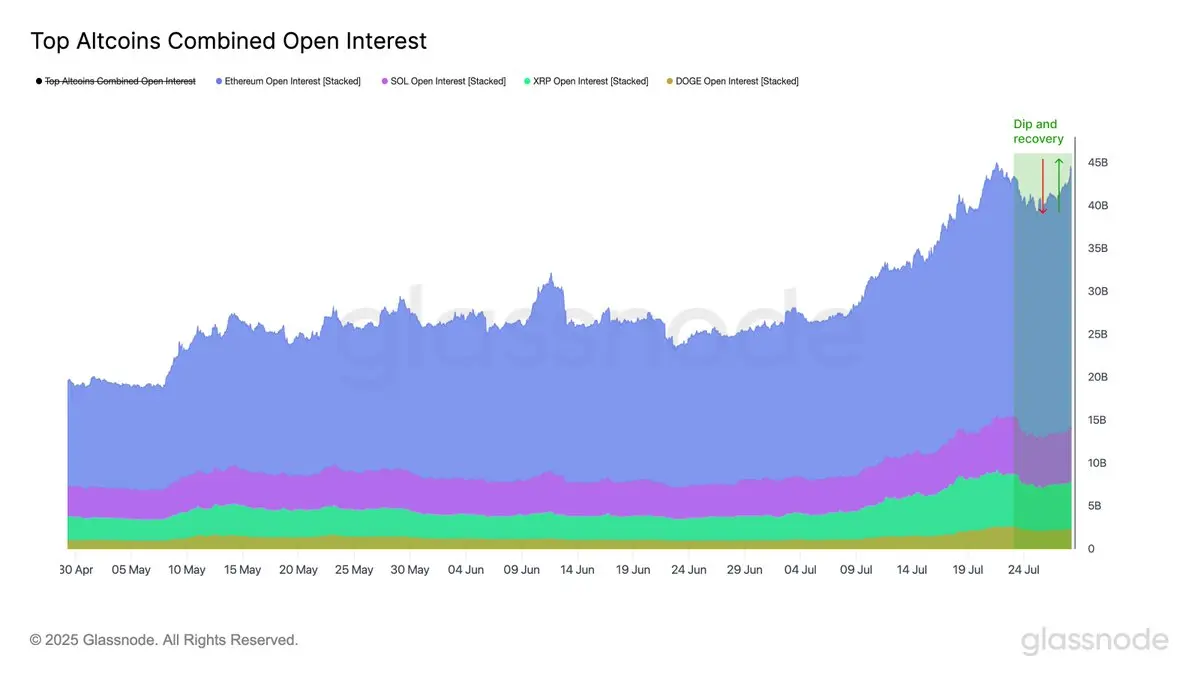
After dipping slightly before the weekend, Futures OI across major #altcoins# is recovering. The combined OI of $ETH, $SOL and $XRP has rebounded sharply to $44.2B - just shy of last week’s high ($45B). $ETH OI saw the biggest swing while $SOL and $XRP were more stable.
ETH-4.95%
SOL-3.44%
XRP-0.53%
post-image
  • Reward
  • Comment
  • Share
$BTC options skew shows an unusual divergence: 1M puts trade at a premium (+4.6%), while 1W skew lags.
This suggests near-term bullish sentiment, with traders using 1W calls, while 1M downside protection signals hedging or profit-taking on the rally.
BTC-1.51%
RLY-10.94%
post-image
  • Reward
  • Comment
  • Share
The $110K–$117K range is gradually filling in. $BTC is being accumulated on both sides - buyers stepping in on dips, while earlier buyers are now acquiring at higher levels, forming a staircase-like pattern in cost basis distribution.
BTC-1.51%
post-image
  • Reward
  • Comment
  • Share
The $117K level continues to attract demand, with ~73K $BTC now held at this cost basis. Each dip is being absorbed, as investors steadily accumulate in this range:
BTC-1.51%
post-image
  • Reward
  • 1
  • Share
Tasya0511vip:
thank you for the Insights! 👌🏼
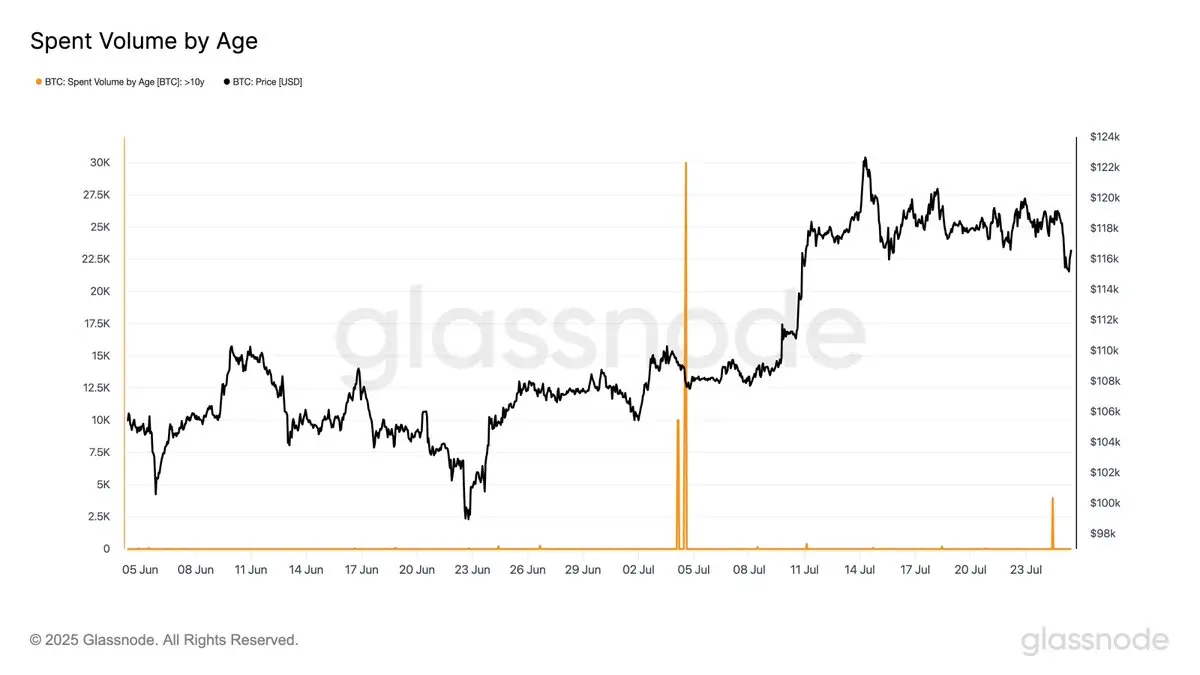
Yesterday saw another wave of ancient coins move on-chain, with 3.9k BTC aged over 10 years becoming active. This follows the 80k BTC that moved on July 4, 2025. Such activity from long-dormant supply often reflects internal reallocation, custodial shifts, or in some cases sell-side pressure.
MOVE-1.68%
BTC-1.51%
post-image
  • Reward
  • Comment
  • Share
The sharp rally from $110k to $117k created an on-chain air gap or a low-density accumulation zone. Since the $122.6k ATH, price has held above it. If support fails, history shows such gaps can still evolve into bottom formation zones.
RLY-10.94%
post-image
  • Reward
  • Comment
  • Share
  • Topic
    1/3
  • Pin
Trade Crypto Anywhere Anytime
qrCode
Scan to download Gate app
Community
English
  • 简体中文
  • English
  • Tiếng Việt
  • 繁體中文
  • Español
  • Русский
  • Français (Afrique)
  • Português (Portugal)
  • Bahasa Indonesia
  • 日本語
  • بالعربية
  • Українська
  • Português (Brasil)